Figures & data
Figure 1. Illustration of the reproducibility crisis: the blue circle represents the hypothetico-deductive process of the scientific method, and at each step, threats to this model are indicated in underneath. Figure reproduced from Munafò et al. (Citation2017), without adaptations, under a CC-BY 4.0 license.
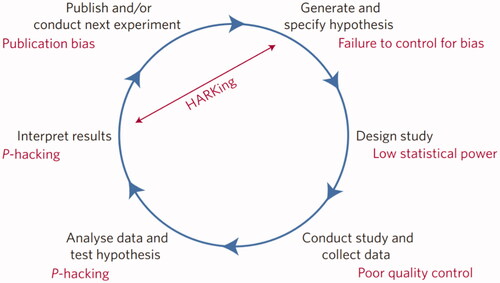
Figure 2. Traditional RR workflow. Figure reproduced from the Center for Open Science (www.cos.io/rr. ), without adaptations, under a CC-BY 4.0 license.

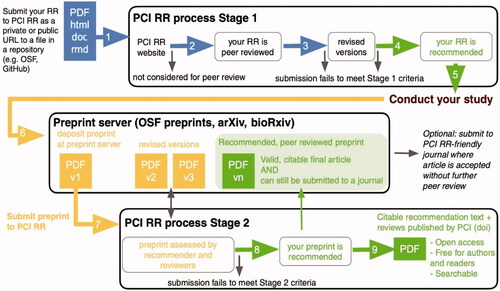
Figure 3. Process of PCI RR track. Figure reproduced from https://rr.peercommunityin.org/about/about, without adaptations, under a CC-BY 4.0 license.