
Figures & data
Figure 1. The pain of paying hypothesis. As the pain of paying increases, risky behavior should decrease. (A) Hypothesis 1 predicts increased gambling when participants receive the money to gamble as a voucher, compared to cash. (B) Hypothesis 2 predicts decreased gambling when participants earn money to gamble, compared to a cash windfall. Image source for $5 bills: Bank of Canada.
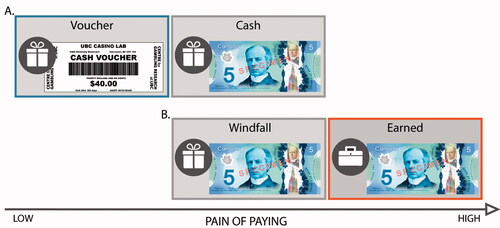
Figure 2. Trial structure for the trial-level analysis. Spin initiation latency and next bet size (in red) were analyzed as a function of the current state of the machine at *, after the outcome.
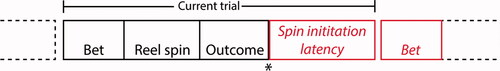
Table 1. Demographic and session-level variables.
Figure 3. Observed and predicted data for the spin initiation latency models. Observed data shown using Tukey boxplots. Spin initiation latency as a function of machine balance in experiment 1a (A) and experiment 1 b (B). Spin initiation latency as a function of loss streak length in experiment 1a (C) and experiment 1 b (D). Spin initiation latency as a function of the size of a win in experiment 1a (E) and experiment 1 b (F).
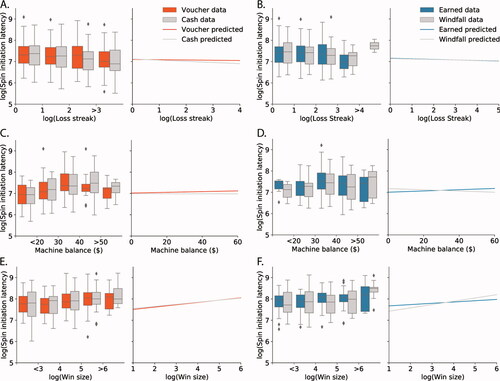
Table 2. Predictors of interest in the models of spin initiation latency.
Figure 4. Observed and predicted data for the next bet size models. Observed data shown using Tukey boxplots. Probability of the next bet being higher than the participants median bet as a function of machine balance in experiment 1a (A) and experiment 1 b (B). Probability of the next bet being higher than the participants median bet as a function of loss streak length in experiment 1a (C) and experiment 1 b (D). Probability of the next bet being higher than the participants median bet as a function of the size of a win in experiment 1a (E) and experiment 1 b (F).
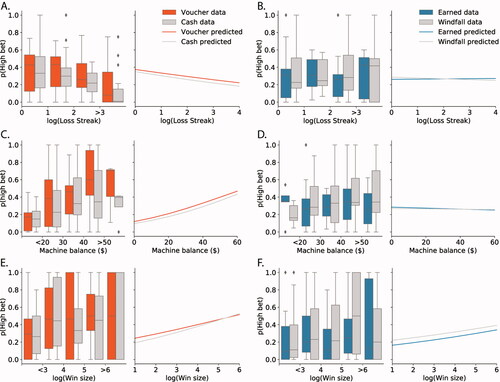
Table 3. Predictors of interest in the next bet models.