Figures & data
Table 1. Sociodemographic characteristics of the sample.
Table 2. Descriptive statistics (M and SD) for main study variables (N = 337).
Figure 1. Changes in alcohol use, alcohol-related problems, stress, and boredom during social isolation (N = 337). Note. Both prevalence estimates (top) and effect sizes (bottom) were calculated using imputed data (m = 40). Adjusted models controlled for age, gender, ethnicity, socioeconomic status, the number of symptoms experienced, and whether the respondent was isolating with children. 1 unit = 8 g pure ethanol; 1 heavy day = consuming >8 units per day for men or >6 units per day for women; APQ: Alcohol Problems Questionnaire; SOS-S: Short Stress Overload Scale; MSBS: Multidimensional State Boredom Scale. *FDR-adjusted p < .05, **FDR-adjusted p < .01, ***FDR-adjusted p < .001.
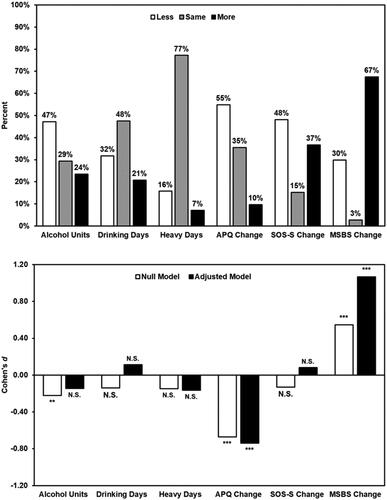
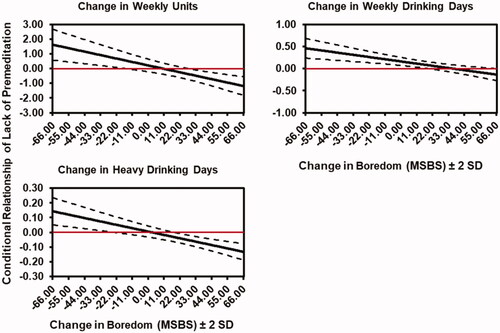
Figure 2. Johnson-Neyman plots illustrating significant inhibitory control x boredom interactions (N = 337). Note. Models were fitted using imputed data (m = 40). Models were adjusted for age, gender, ethnicity, socioeconomic status, the number of symptoms experienced and whether the respondent was isolating with children. The first imputed dataset was used to visualize statistically significant interactions. 1 unit = 8 g pure ethanol; 1 heavy drinking day = consuming > 8 units per day for men or > 6 units per day for women. Dashed lines represent the 95% CI.