Figures & data
Figure 1. Simulated network analyses. The network depicted in was simulated to illustrate reliable distinctness between assumed entities (high modularity, i.e., strong within-community relationships and weak between-community relationships). The network depicted in was simulated to illustrate unreliable distinctness between assumed entities (low modularity, i.e., comparable within-community relationships and between-community relationships). Circles reflect items. Circle coloring reflects community membership. Green lines reflect positive pairwise associations between items, whereas red lines reflect negative pairwise associations between items. Line thickness reflects the magnitude of relationships between objects. The approach used to simulate these two networks and the related code are available from https://osf.io/p4x6t/.
![Figure 1. Simulated network analyses. The network depicted in Figure 1A was simulated to illustrate reliable distinctness between assumed entities (high modularity, i.e., strong within-community relationships and weak between-community relationships). The network depicted in Figure 1B was simulated to illustrate unreliable distinctness between assumed entities (low modularity, i.e., comparable within-community relationships and between-community relationships). Circles reflect items. Circle coloring reflects community membership. Green lines reflect positive pairwise associations between items, whereas red lines reflect negative pairwise associations between items. Line thickness reflects the magnitude of relationships between objects. The approach used to simulate these two networks and the related code are available from https://osf.io/p4x6t/.](/cms/asset/09894116-3113-4b7b-a0e4-0c26116b6266/iart_a_2125508_f0001_c.jpg)
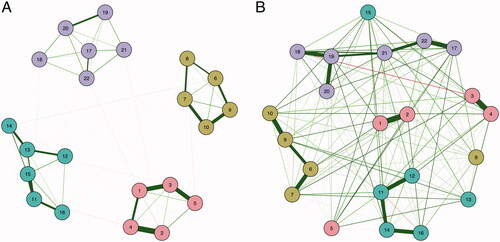
Figure 2. Network analyses. The network depicted in was estimated from the data provided by Karhulahti et al. (Citation2022). The graphical behavior of the estimated network resembles the network depicted in , illustrating unreliable distinctness between assumed entities (low modularity, i.e., comparable within-community relationships and between-community relationships). Circles reflect items. Circle coloring reflects community membership. Green lines reflect positive pairwise associations between items, whereas red lines reflect negative pairwise associations between items. Line thickness reflects the magnitude of relationships between objects. The approach used to estimate this network and the related code are available from https://osf.io/p4x6t/.
![Figure 2. Network analyses. The network depicted in Figure 2 was estimated from the data provided by Karhulahti et al. (Citation2022). The graphical behavior of the estimated network resembles the network depicted in Figure 1B, illustrating unreliable distinctness between assumed entities (low modularity, i.e., comparable within-community relationships and between-community relationships). Circles reflect items. Circle coloring reflects community membership. Green lines reflect positive pairwise associations between items, whereas red lines reflect negative pairwise associations between items. Line thickness reflects the magnitude of relationships between objects. The approach used to estimate this network and the related code are available from https://osf.io/p4x6t/.](/cms/asset/9aa293df-b1e4-4053-8b24-dce4aafed2bc/iart_a_2125508_f0002_c.jpg)
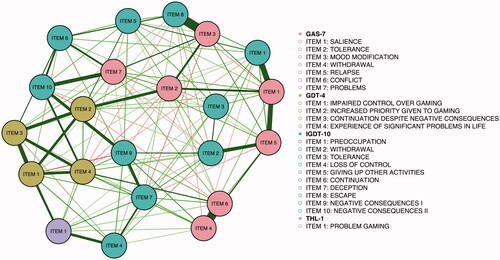
Table 1. Item formulation differences.