
Figures & data
Table 1. Descriptive statistics (mean, standard deviations (SD) and range) of the total sample (n = 546).
Table 2. Hierarchical regression predicting AUDIT scores, predictor variables are presence of meaning, search for meaning, and average alcohol-free reinforcement after controlling for age and gender.
Figure 1. Direct and indirect relationships between meaning in life, alcohol consumption, alcohol-free reinforcement, alcohol value, depressive symptoms, and drinking to cope.
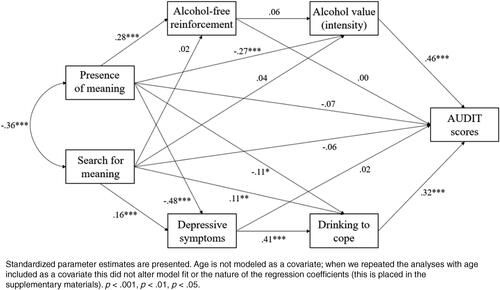
Table 3. Indirect effects from the structural equation model.
Supplemental material
Supplemental Material
Download MS Word (275.2 KB)Data availability statement
Data and analysis scripts are available and can be found on Research Box: https://researchbox.org/677