
Figures & data
Table 1. The PCI RR study design template.
Table 2. Descriptive statistics of participants’ gambling behavior.
Table 3. Responses to outcome measure of correct understanding.
Figure 1. Plot of the difference between the original and alternative house edge conditions on their perceived chances of winning. The dashed lines are the smallest effect sizes of interest for the equivalence test. Negative values suggest lower perceived chances of winning in the alternative phrasing condition.
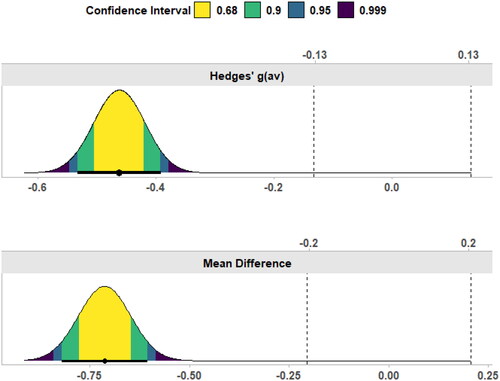
Figure 2. Plot of the difference between the house edge conditions in their correct understanding of the information given to them. The dashed lines are the smallest effect sizes of interest for the equivalence test. Negative values suggest lower rates of accurate understanding in the alternative phrasing condition.
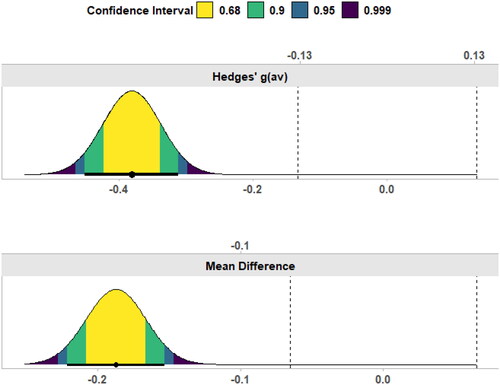
Table 4. Regression model results comparing the two house-edge conditions, while adding a main effect of PGSI and an interaction term.