692
Views
0
CrossRef citations to date
0
Altmetric
Research Articles

Does childhood adversity alter opioid drug reward? A conceptual replication in outpatients before surgeryOpen Materials

, , , , , , , & show all
Pages 46-57 | Received 24 Apr 2023, Accepted 02 May 2023, Published online: 21 May 2023

Figures & data

Figure 1. Study procedure in the context of the broader research project. T: timepoint for data collection. T4 is in grayscale to indicate that outcomes were collected but are not included within the current study. CTQ: childhood trauma questionnaire, SES: socio-economic status.

Figure 1. Study procedure in the context of the broader research project. T: timepoint for data collection. T4 is in grayscale to indicate that outcomes were collected but are not included within the current study. CTQ: childhood trauma questionnaire, SES: socio-economic status.

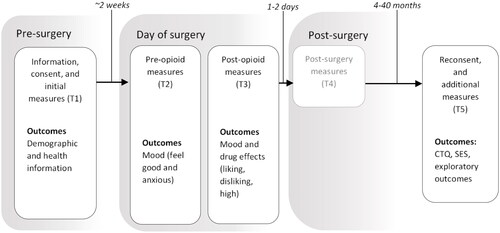
Table 1. Sample Descriptives for Patients (n = 151) Involved in This Study.

Figure 2. Overlay of scatter plot and regression line (with the shaded 95% confidence interval band) for the effect of childhood adversity on post-opioid a) liking of the effects and b) feeling good. There was a modest yet significant effect of childhood adversity (CTQ total score) on post-opioid liking (b = –0.06, p = 0.046) where an average 1 Likert unit increase across all of the CTQ items (rated on a 1–5 Likert scale) led to a significant –1.5 NRS unit decrease in liking. There were no significant effects of CTQ total score on feeling good (b = 0.01, p = 0.690). While the range of the CTQ total score is 25–125, the maximum score did not exceed 72 in this patient population. The red dotted vertical lines crossing the x-axis are to visually illustrate total scores with an average 1 Likert unit difference for the CTQ items (equivalent to a 25-point difference in the CTQ total score), starting from the lowest total score. The regression lines and respective models adjusted for age, sex, weight, opioid type, and surgery type. As these variables were mean-centred prior to plotting, the regression line reflects predicted liking and feel-good averaged across gender, drug, age, and weight for an individual that is undergoing the most common surgery (minor abdominal surgery).

Figure 2. Overlay of scatter plot and regression line (with the shaded 95% confidence interval band) for the effect of childhood adversity on post-opioid a) liking of the effects and b) feeling good. There was a modest yet significant effect of childhood adversity (CTQ total score) on post-opioid liking (b = –0.06, p = 0.046) where an average 1 Likert unit increase across all of the CTQ items (rated on a 1–5 Likert scale) led to a significant –1.5 NRS unit decrease in liking. There were no significant effects of CTQ total score on feeling good (b = 0.01, p = 0.690). While the range of the CTQ total score is 25–125, the maximum score did not exceed 72 in this patient population. The red dotted vertical lines crossing the x-axis are to visually illustrate total scores with an average 1 Likert unit difference for the CTQ items (equivalent to a 25-point difference in the CTQ total score), starting from the lowest total score. The regression lines and respective models adjusted for age, sex, weight, opioid type, and surgery type. As these variables were mean-centred prior to plotting, the regression line reflects predicted liking and feel-good averaged across gender, drug, age, and weight for an individual that is undergoing the most common surgery (minor abdominal surgery).

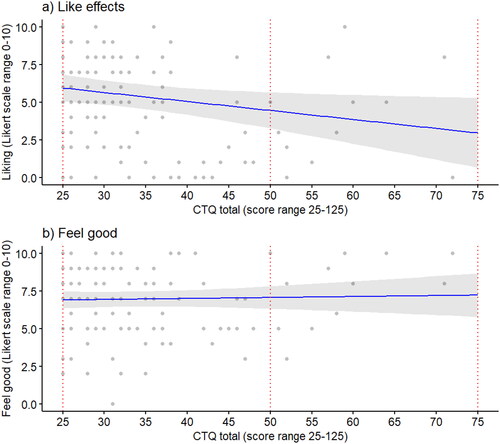
Table 2. Regression model estimates for post-drug liking and feeling good.

Figure 3. Subjective opioid effects (feeling good, feeling anxious, and drug-specific effects for liking, disliking, and feeling high post-opioid) stratified by group: (i) patients that scored in the ‘none’ category across all CTQ subscales (n = 76), (ii) patients that scored in the ‘low’ or ‘moderate’ category for one or more (denoted as ‘1+’ in the figure legend) of the CTQ subscales, but never in the severe category (n = 52), and (iii) patients that scored severe on one or more (1+) subscales (n = 15). Error bars represent standard errors.

Figure 3. Subjective opioid effects (feeling good, feeling anxious, and drug-specific effects for liking, disliking, and feeling high post-opioid) stratified by group: (i) patients that scored in the ‘none’ category across all CTQ subscales (n = 76), (ii) patients that scored in the ‘low’ or ‘moderate’ category for one or more (denoted as ‘1+’ in the figure legend) of the CTQ subscales, but never in the severe category (n = 52), and (iii) patients that scored severe on one or more (1+) subscales (n = 15). Error bars represent standard errors.

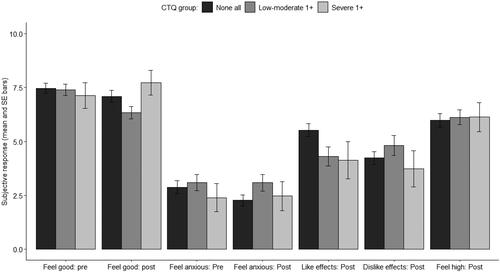
Table 3. Correlation matrix for exploratory variables (total scores) with post-drug effects.