Figures & data
Table 1. Demographic characteristics of the sample.
Table 2. Gambling engagement of the sample.
Table 3. Safer gambling messages and their abbreviations.
Figures 1–7. Mean (± 1 standard error) ratings of agreement by jurisdiction. Brackets indicate messages that are not significantly different to the highest rating in the bracket.
![Figures 1–7. Mean (± 1 standard error) ratings of agreement by jurisdiction. Brackets indicate messages that are not significantly different to the highest rating in the bracket.](/cms/asset/e41b7702-eab7-4908-801b-a114b2ba53ac/iart_a_2282545_f0001a_c.jpg)
![Figures 1–7. Mean (± 1 standard error) ratings of agreement by jurisdiction. Brackets indicate messages that are not significantly different to the highest rating in the bracket.](/cms/asset/23f1025f-e626-4b8a-9153-b4d867542c51/iart_a_2282545_f0001b_c.jpg)
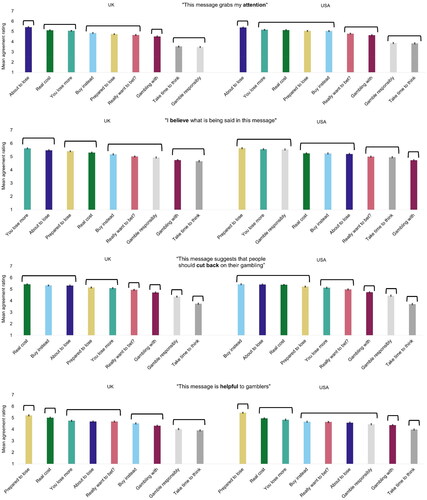
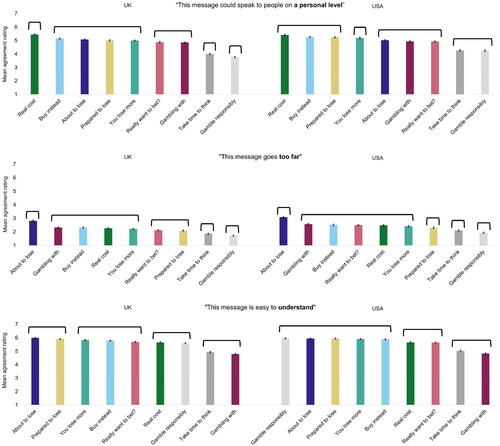
Table 4. Omnibus main effect and interaction F-values (with eta-squared values) for each statement.