
Figures & data
Table 1. Game sections.
Table 2. Descriptive statistics.
Figure 1. Average frequency of television gambling advertisements by game section and year.
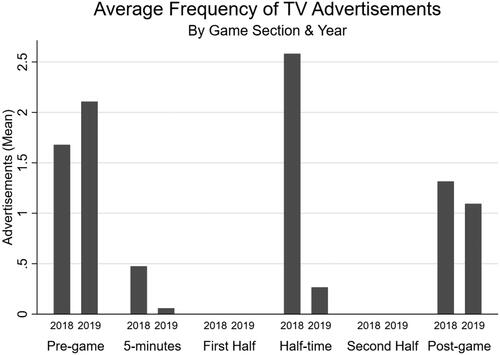
Table 3. Inverse probability weighted (IPW) matching model results.
Figure 2. Density plot of covariate balance (channel the game was televised on) in the IPW models.
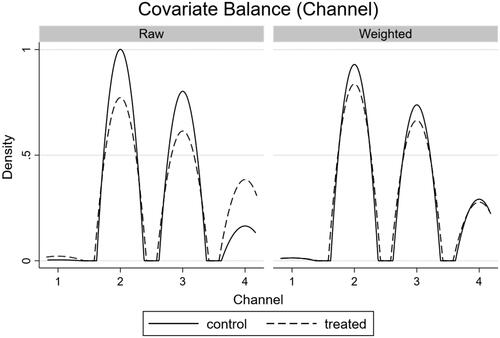
Figure 3. Density plot of covariate balance (day of the week the game was televised) in the IPW models.
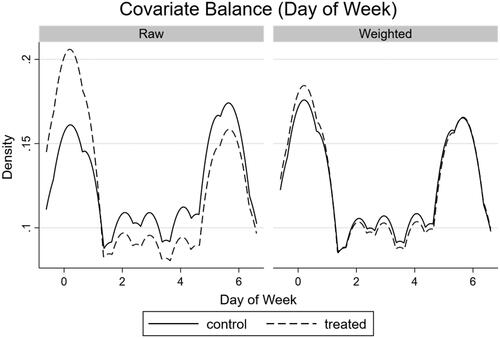
Figure 4. Density plot of covariate balance (time the game was televised) in the IPW models.
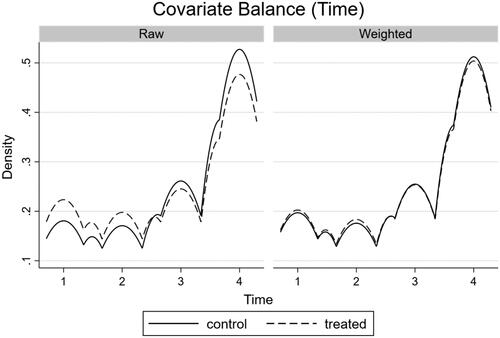
Table 4. Balance of covariates in IPW models.
Supplemental Material
Download MS Word (37.1 KB)Data sharing agreement
Advertising data used in this study is not available for sharing due to licensing restrictions. However, STATA do-files and log-files are available on request from the corresponding author (EM), in addition to the scraped kickoff dataset.