Figures & data
Table I: Macronutrient composition of each test meal per 100 g edible portion
Table II: Macronutrient composition of each test meal and glucose used in a cohort of 100 type 2 diabetes mellitus patients and 100 non-diabetic subjects
Figure 1: Mean plasma glucose concentrations at 0, 15, 30, 45, 60, 90 and 120 minutes after the consumption of glucose or the test meals by the non-diabetic subjects (control group)*
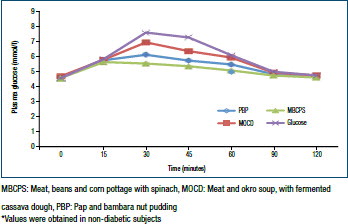
Figure 2: Mean fasting and postprandial plasma glucose concentrations after the consumption of the test meals by the subjects with type 2 diabetes mellitus*
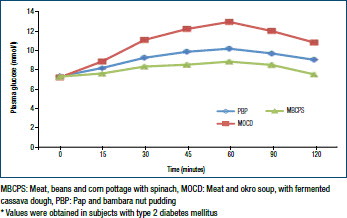
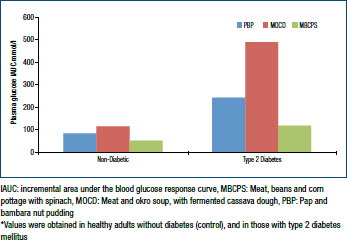
Figure 3: Mean incremental area under the blood glucose response curve for plasma glucose after the consumption of the test meals by non-diabetic and type 2 diabetes mellitus subjects*