
Figures & data
Table 1: Food-group classification for the foods and drinks reported during the 24-hour recall period
Table 2: Sociodemographic and household characteristic of study participants
Table 3: Median intakes and interquartile ranges for total energy and nutrient intakes for infants at age 6 to <9 months (n = 144)
Figure 1: Percentage of infants who consumed different food groups on the day of recall (n = 144). ‘Grains, roots, and tubers’ include infant cereals; dairy includes formula milk; F&V: fruits and vegetables.
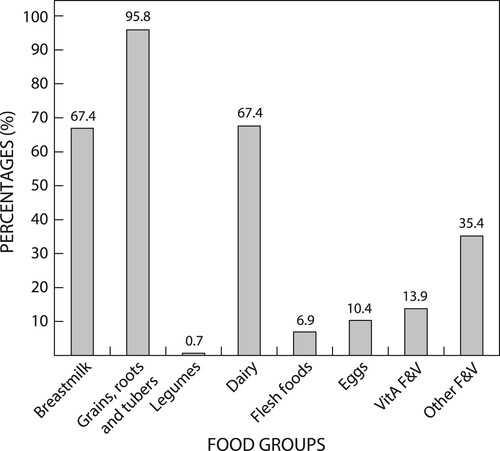
Table 4: Percentage contribution of different food groups towards total energy and nutrient intake of consumers at age 6 to <9 months
Table 5: Total energy and nutrient intake of consumers versus non-consumers of different food groups at age 6–9 monthsTable Footnotea
Table 6: Median (interquartile range) for micronutrient density (amount per 418 kJ) between consumers and non-consumers of different food groups at age 6–9 months
Table 7: Association of different food group consumption with the mean adequacy ratio for those who consumed the food group on the day of recall