Figures & data
Table 1. Clinical data of the patients recruited in this study.
Table 2. Plasma proteins differentially expressed in β-thalassemia/Hb E patients treated with curcuminoids antioxidant cocktail.
Table 3. Plasma proteins differentially expressed in β-thalassemia/Hb E patients treated with vitamin E antioxidant cocktail.
Figure 1. (A) Correlations between vitronectin intensities and total bilirubin levels; (B) The ELISA results of vitronectin in normal subjects and patients treated with curcuminoids and vitamin E antioxidant cocktails. * p < .001 compared to normal; ** p < .05 compared to normal; a p < .001 compared to baseline; b p < .05 compared to baseline.
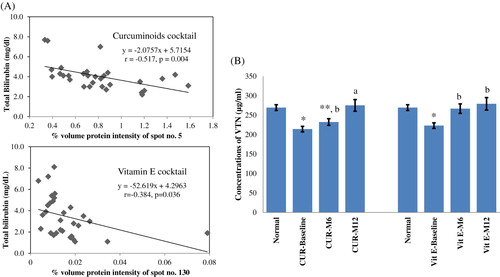
Figure 2. (A) Correlations between paraoxonase/arylesterase 1 intensities and blood reactive oxygen species; (B) The ELISA results of paraoxonase/arylesterase 1 in normal subjects and patients treated with curcuminoids antioxidant cocktail. * p < .001 compared to normal; ** p < .05 compared to normal; a p < .05 compared to baseline.
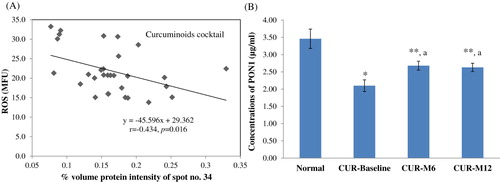
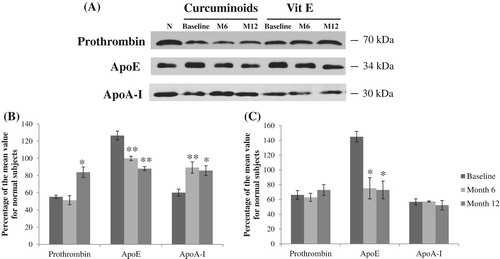
Figure 3. (A) The bands of Western blots corresponding to prothrombin, apolipoprotein E, and apolipoprotein A-1 of normal subjects (N), thalassemic patients at baseline, month 6 (M6), and month 12 (M12) after curcuminoids- and vitamin E antioxidant cocktails treatments. The graphs (B) and (C) represent the quantitation of the Western blots for these proteins as percentage of the mean value for normal subjects in curcuminoids- and vitamin E antioxidant cocktails groups, respectively. Values were mean ± SEM. * p < .05 and ** p < .01 compared to baseline.