Figures & data
Figure 1. Recovery of peripheral blood counts during induction chemotherapy treatment days 1–36 in 63 children with ALL. (A) Partial recovery, percentages of children in whom Hb values have stabilized >5.0 mmol/L (solid), platelet counts >50/nL (dotted), and neutrophil counts >0.5/nL (stippled). (B) Complete recovery, percentages with Hb >6.0 mmol/L (solid), platelet counts >100/nL (dotted), and neutrophil counts >1.0/nL (stippled).
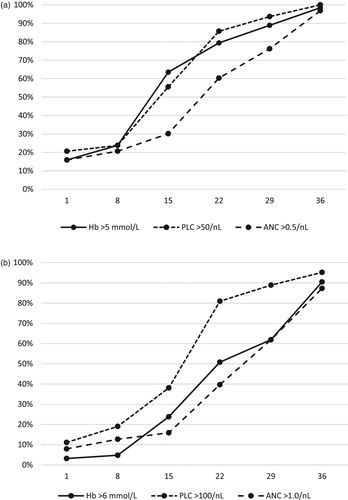
Table 1. Comparison of time to partial recovery from very low blood counts during induction chemotherapy and the associated morbidity in children with standard risk, intermediate risk, and high risk ALL.
Table 2. Comparison of morbidity during induction in children with early recovery, defined as PLC stabilized >50/nL by day 15, and late recovery. The group with early recovery includes six children with all three counts normal throughout induction.
Figure 2. Comparison of recovery in children with ALL with good response (MRD <0.1% day 29, n = 41) and with poor response (MRD day 29 ≥ 0.1%, n = 22). (A) Percentages of good (solid) and poor (stippled) responders with platelet count stabilized >100/nL. (B) Percentages of good (solid) and poor (stippled) responders with neutrophil count stabilized >1.0/nL.
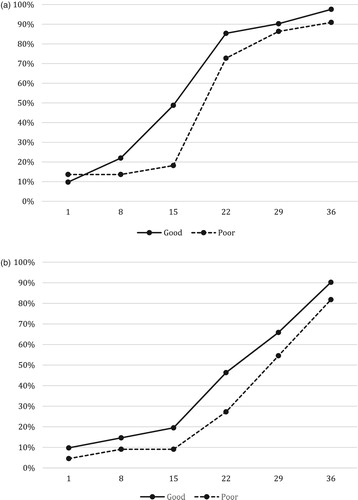
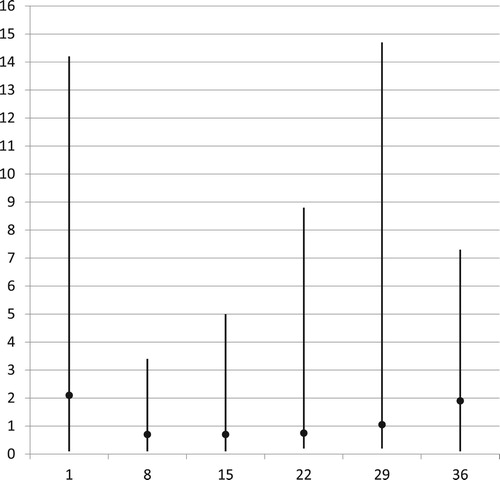
Figure 3. Absolute lymphocyte counts per nL during induction chemotherapy in 63 children with ALL: Range and median values on treatment days 1–36 (n = 53–59, 34 for day 22 because of missing values).