
Figures & data
Figure 1. Flow/chart of literature review process.
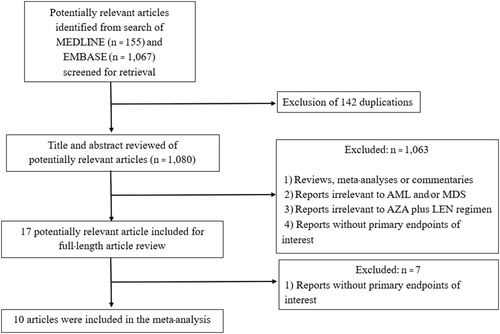
Table 1. Baseline characteristics of studies included in the meta/analysis.
Table 2. Azacitidine-plus-lenalidomide regimens used in the included studies.
Figure 2. Forest plots of pooled overall CR rate (A) and overall response rate (B) after treatment with AZA/plus/LEN regimen.
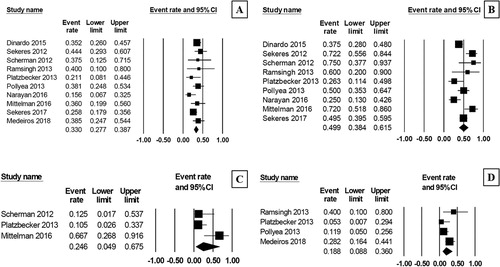
Figure 3. Forest plots of pooled rate of grade 3–4 neutrophil toxicity (A) and grade 3–4 platelet toxicity (B) during treatment with AZA/plus/LEN regimen.
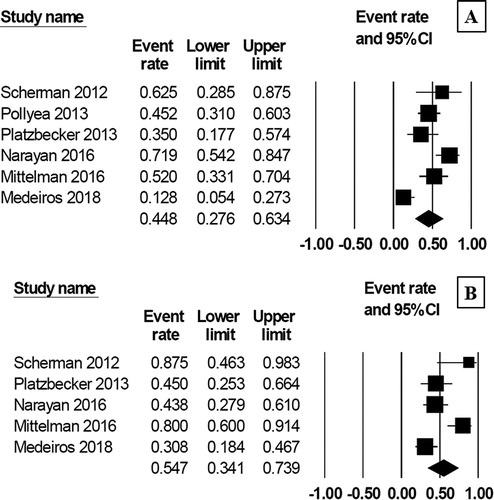
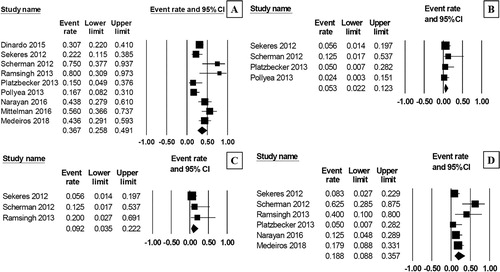
Figure 4. Forest plots of pooled febrile neutropenia rate (A), thrombotic event rate (B), acute renal failure rate (C) and treatment related mortality rate (D) during treatment with AZA/plus/LEN regimen.
Supplemental material