
Figures & data
Figure 1. Flow diagram of the study selection process.
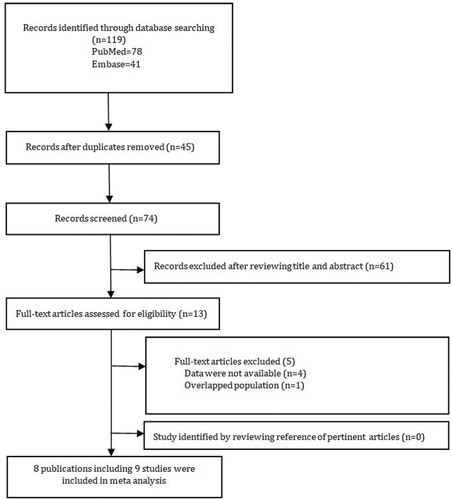
Table 1. Characteristics of the studies included.
Table 2. Methodological quality scores of the selected articles.
Table 3. Methodological quality scores of the selected articles.
Figure 2. Forest plot presenting weighted mean differences (WMD) of the permanent decayed, missing and filled teeth (DMFT) between patients with SCD and non-SCD participants. CI: Confidence interval. SCD: Sickle cell disease. Non-SCD: participants without sickle cell disease.
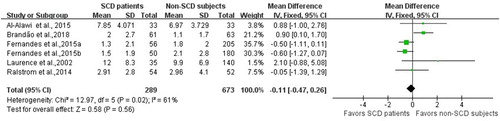
Figure 3. Forest plot presenting weighted mean differences (WMD) of the permanent decayed, missing and filled surface (DMFS) between patients with SCD and non-SCD participants. CI: Confidence interval. SCD: Sickle cell disease. Non-SCD: participants without sickle cell disease.
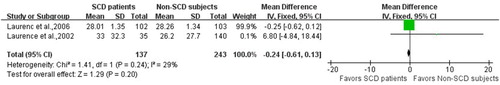
Table 4. Results of subgroup analyses.
Supplemental material