Figures & data
Figure 1. Morphology of peripheral blood erythrocytes (Wright–Giemsa, magnification, ×400). (A) Size of mature erythrocytes from proband varies. Some areas of lightly-stained, oval, spherical, and target-shaped central are expanded. (B) Mother; (C) Father; (D) Older brother.
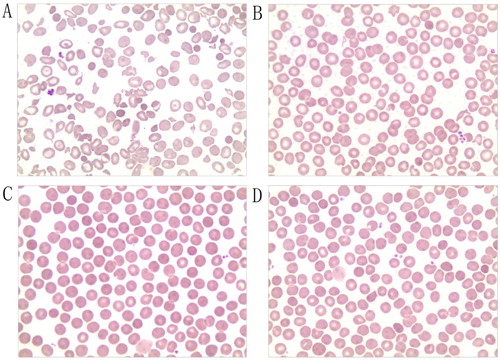
Table 1. Laboratory findings of the proband and his family members.
Figure 2. Pedigree of a Chinese family with hereditary spherocytosis and β-thalassemia trait. Black arrow, proband.
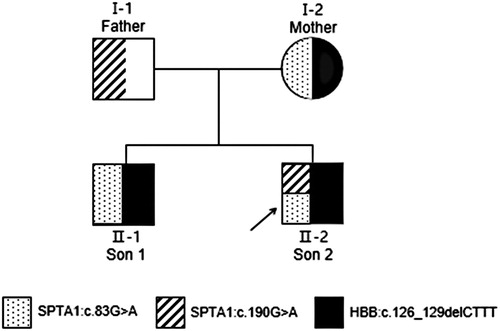
Figure 3. Findings of SPTA1:c.83G > A mutation. Arrows, mutation sites. (A) Proband, heterozygous mutation. (B) Mother, heterozygous mutation. (C) Father, normal. (D) Older brother, heterozygous mutation.
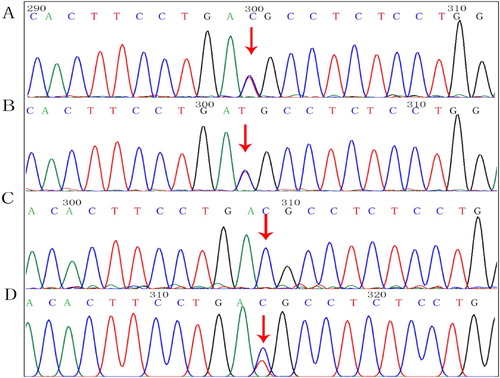
Figure 4. Findings of SPTA1: c.190G > A mutation. Arrows, mutation sites. (A) Proband, heterozygous mutation. (B) Mother, normal. (C) Father, heterozygous mutation. (D) Older brother, normal.
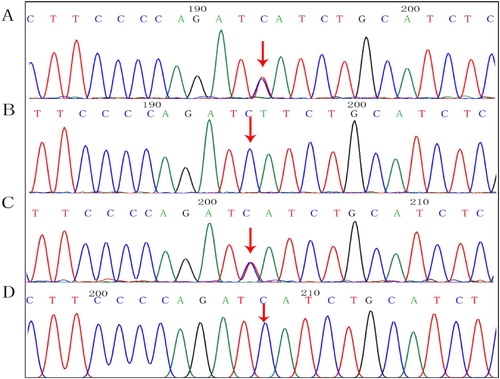
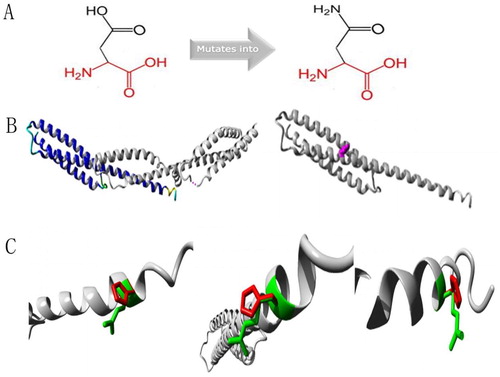
Figure 5. Protein structure analyses of SPTA1:c.83G > A. (A) Schematic structures of original (left) and the mutant (right) amino acids. Red, backbone, which is same for each amino acid. Black, side chain that is unique to each amino acid. (B) Left: overview of protein in ribbon presentation. Proteins are colored as follows: blue, α-helix; red, β-strand; green, turn; yellow, 3/10 helix; cyan, random coil; gray, other molecules. Right: Overview of mutant protein in ribbon presentation. Gray, protein; magenta, side chain of mutated residue (pink spheres). (C) Close-up of mutation. Gray, protein; green and red, wild-type and mutant residues, respectively. Structure is shown from three angles.
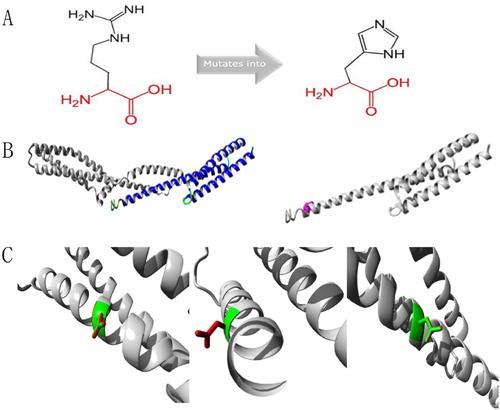
Figure 6. Protein structure analyses of SPTA1:c.190G > A.(A) Schematic structures of original (left) and the mutant (right) amino acids. Red, backbone, which is same for each amino acid. Black, side chain that is unique to each amino acid. (B) Left: overview of protein in ribbon presentation. Proteins are colored as follows: blue, α-helix; red, β-strand; green, turn; yellow, 3/10 helix; cyan, random coil; gray, other molecules. Right: Overview of mutant protein in ribbon presentation. Gray, protein; magenta, side chain of mutated residue (pink spheres). (C) Close-up of mutation. Gray, protein; green and red, wild-type and mutant residues, respectively. Structure is shown from three angles.