Figures & data
Table 1. Characteristics of AML patients with and without ASXL1 mutations.
Table 2. AML patients with and without ASXL1 mutations and FAB classification.
Table 3. AML patients with and without ASXL1 mutations and chromosome karyotype.
Table 4. ASXL1 mutations and some other common AML prognosis-related mutations.
Figure 1. The K-M survival curve of ASXL1 mutations in total AML patients. (a) OS (n = 145), (b) EFS (n = 139).
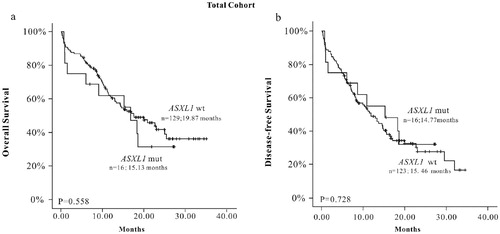
Table 5. Survival analysis (OS and DFS) in 55 CN-AML patients.
Table 6. Multivariate analysis of CN-AML patients on long-term survival.
Figure 2. The K-M survival curve of ASXL1 mutations in CN-AML patients, (a) OS (n = 55), (b) DFS (n = 55).
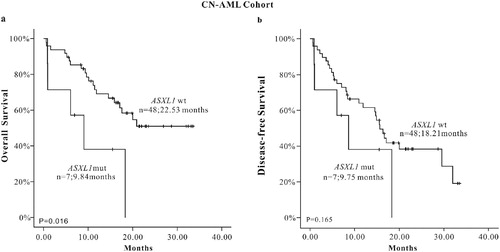
Figure 3. The K-M survival curve of ASXL1 mutations in AML (age > 0 years) patients, (a) OS (n = 36), (b) DFS (n = 33)
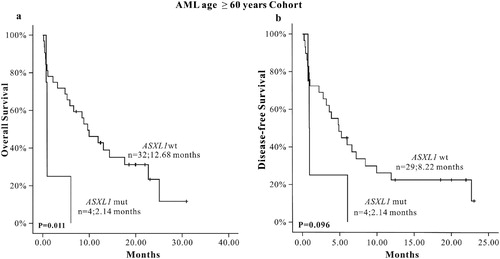
Table 7. Influencing factors analysis on survival (OS and DFS) of 36 elderly (≥60 years) AML patients.
Table 8. Multivariate analysis of elderly (≥60 years) AML patients on long-term survival.
Figure 4. The K-M survival curve of TET2 mutations in total AML patients, (a) OS (n = 145), (b) DFS (n = 139); The K-M survival curve of TET2 mutations when accompanied with ASXL1 mutations in AML patients, (c) OS (n = 25), (d) DFS (n = 25).
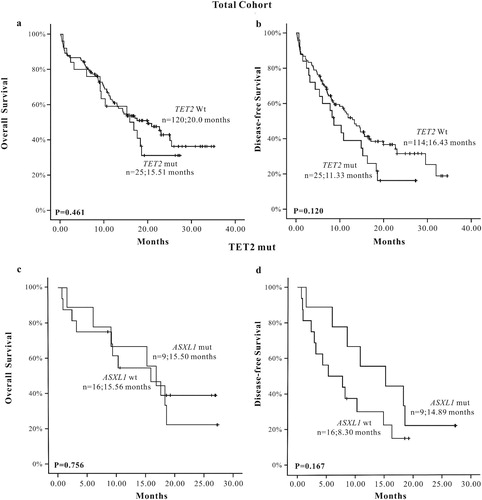
Figure 5. The K-M survival curve of DNMT3A mutations in total AML patients, (a) OS (n = 145), (b) DFS (n= 139); The K-M survival curve of DNMT3A mutations when accompanied with ASXL1 mutations in AML patients, (c) OS (n = 24), (d) DFS (n = 24).
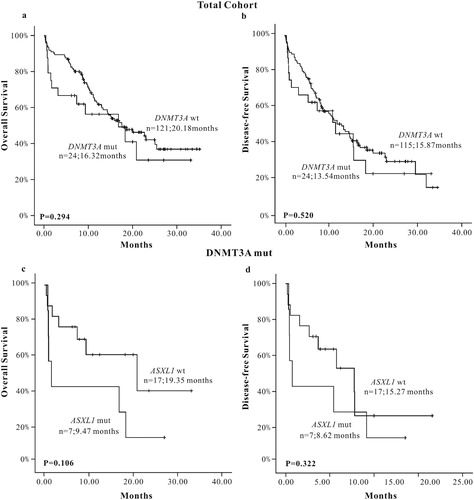
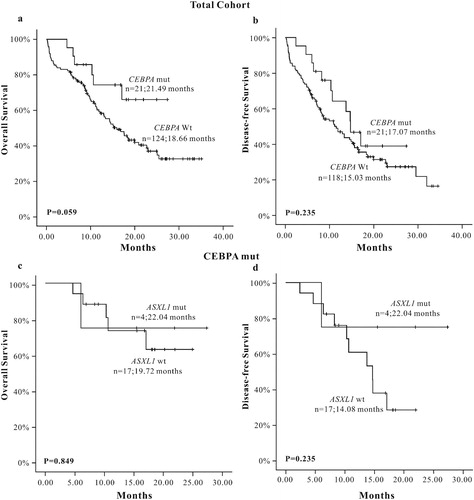
Figure 6. The K-M survival curve of CEBPA mutations in total AML patients, (a) OS (n = 145), (b) DFS (n = 139); The K-M survival curve of CEBPA mutations when accompanied with ASXL1 mutations in AML patients, (c) OS (n = 21), (d) DFS (n = 21).