Figures & data
Figure 1. Flow diagram for study selection according to PRISMA.
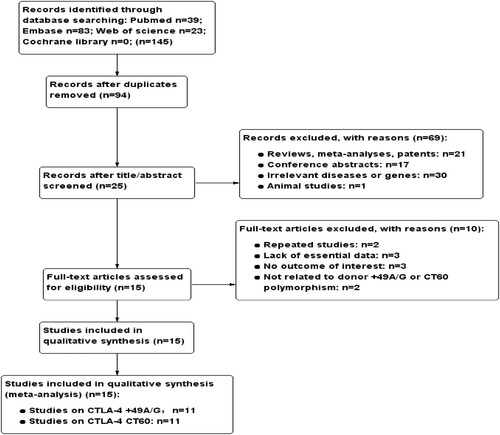
Table 1. Characteristics of studies included in the meta-analysis.
Figure 2. Forest plots of CTLA-4 + 49A/G polymorphism with cGVHD risk in recessive model(GG vs GA + AA).
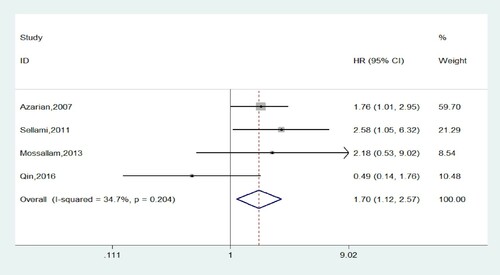
Table 2. Meta-analyses results of the association between CTLA-4 polymorphisms and transplant outcome.
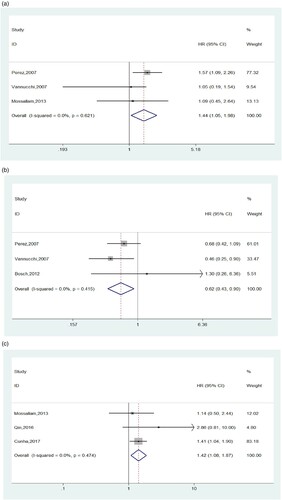
Figure 3. (a) Forest plots of CTLA-4 CT60 polymorphism and overall survival in dominant model(GG + GA vs AA). (b) Forest plots of CTLA-4 CT60 polymorphism and the occurrence of III-IV aGVHD in dominant model (GG + GA vs AA). (c) Forest plots of CTLA-4 CT60 polymorphism and overall survival in recessive model (GG vs GA + AA).