
Figures & data
Table 1. Demographic and clinical characteristics of the study patients.
Table 2. Prevalence of thalassemia complications.
Figure 1. The scatter plot between Hb levels and complications (A) severe hepatic iron overload (B) hypogonadism in TDT patients.
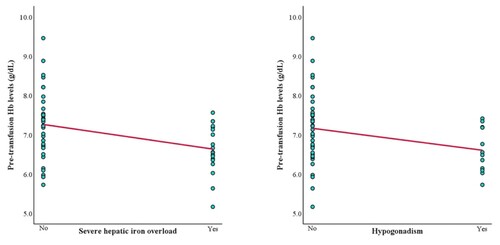
Figure 2. The scatter plot between Hb levels and complications (A) hepatic iron overload (B) osteoporosis (C) pulmonary hypertension in NTDT patients.
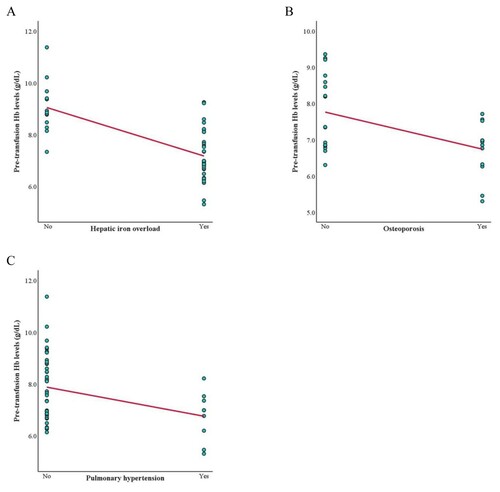
Figure 3. ROC curve for predicting (A) severe hepatic iron overload (B) hypogonadism in TDT patients based on pre-transfusion Hb levels.
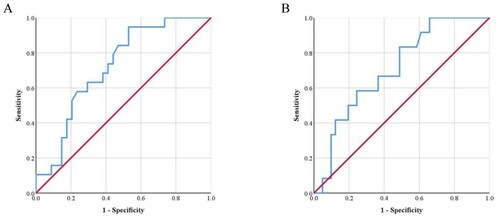
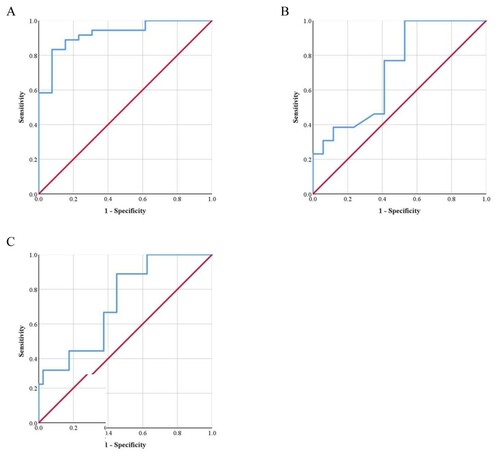
Figure 4. ROC curve for predicting (A) hepatic iron overload (B) osteoporosis (C) pulmonary hypertension in NTDT patients based on pre-transfusion Hb levels.
Supplemental material