
Figures & data
Table 1. Characteristics of patients.
Figure 1. MiRNA expression profiles in childhood acute lymphoblastic leukemia. Clustering analysis of the most significantly differentially expressed miRNAs in childhood acute lymphoblastic leukemia compared with healthy controls (FC ≥ −1.5 or ≤ 1.5, P < 0.05) in GEO datasets GSE56489 (A) and GSE23024 (B). (C) Hierarchical clustering of differentially expressed miRNAs in 6 bone marrow samples, at diagnosis, three of them relapse latter (P < 0.05). (D) Venn diagram showing the intersection of the abnormally expressed miRNAs on the above three datasets.
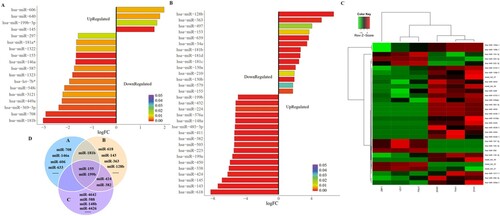
Figure 2. Up-regulated miR-155 is associated with specific risk groups and survival rate of childhood ALL patients. (A, B) MiRNA expression was evaluated by qRT-PCR in 42 newly diagnosed bone marrow samples, ten of whom relapsed latter. U6 was used as an internal reference. (C, D) MiR-155 expression levels in white blood cells (WBCs) and immunophenotype at diagnosis (P>0.05). (E) MiR-155 expression was significantly higher in CNSL patients compared to control (P < 0.05). (F) MiR-155 expression between standard risk status and intermediate risk status patients (P > 0.05). (G) The newly diagnosed bone marrow samples were divided into diagnosis (have no-relapse lately, n=32) and relapse (who relapse lately, n = 10) groups (P > 0.05). (H) Four paired diagnosis-relapse samples were detected. (I, J) High miR-155 expression was associated with poorer OS and EFS rate (P < 0.01). (K, L) The OS and EFS of patients between intermediate risk status and standard risk status (P > 0.05).
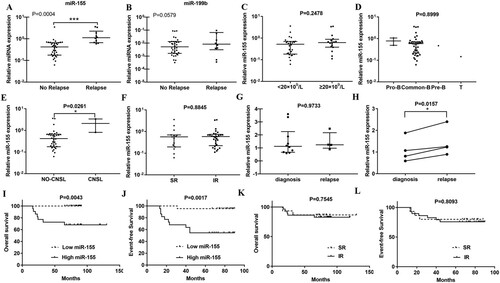
Figure 3. MiR-155 promotes proliferation and inhibits apoptosis of CEM-C1, Jurkat, MOLT-3 and MOLT-4 cells. (A) MTT assay shows that miR-155 obviously promotes cell proliferation. (B) Inhibitor-miR-155 promotes cell apoptosis in the presence of 0.1uM dexamethasone. (C) MiR-155 inhibits the apoptosis in the presence of 1uM dexamethasone. Apoptotic cells were detected at 96 h after transfection.
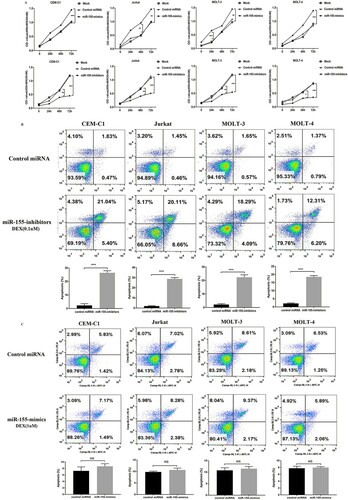
Figure 4. MiR-155 could promote ALL cell proliferation by directly targeting ZNF238. (A) Venn diagram showing the predicted targets of miR-155 in five prediction programs. (B) KEGG pathway enrichment analysis of miR-155 targets. (C) The site sequence of predicted target ZNF238 for miR-155. (D) Luciferase reporter showing luciferase activity in wild-type ZNF238, mutant ZNF238 and controls. (E-G) The protein and mRNA expression of ZNF238 in CEM-C1 and MOLT-4 cell transfected with miR-155 mimics, miR-155 inhibitors or control duplex. (H) ZNF238 expression in childhood ALL. (I, J) MTT assay shows that cell proliferation was significantly inhibited in CEM-C1 and MOLT-4 cells transfected with si-ZNF238.
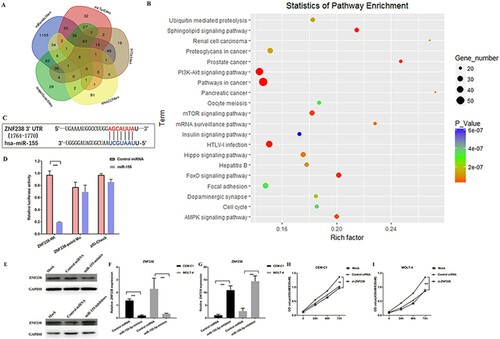
Table 2. The non-oncogene targets which are significantly correlated to miR-155 in leukemia.