Figures & data
Figure 1. Schematic description of F8 Inv1. In wild type, the int1h-1 could be amplified using 9F + 9cR, and the int1h-2 could be amplified using 2F + 2R. In F8 Inv1 patients, int1h-1 could be amplified using 2F + 9cR, and the int1h-2 could be amplified using 9F + 2R.
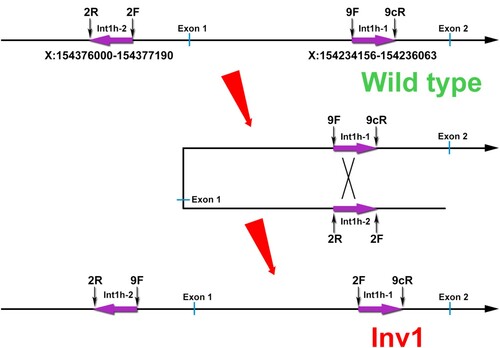
Figure 2. The aberrant patterns of Inv1 in a 1-year-old boy with severe HA. A, The int1h-1 is amplified using int1h-1 specific primers (9F, 9cR) and the int1h-2 specific primer 2F, while the int1h-2 is amplified using int1h-2 specific primers (2F and 2R) and the primer 9F. The boy showed similar int1h-1 band with Inv1 patient, while had similar int1h-2 band with healthy control. His mother had similar int1h-1 bands with Inv1 carrier, while had similar int1h-2 band with healthy control. B, The int1h-1 was amplified in three PCR tubes including different primers, 9F+9cR+2F, 9F+9cR (for wild type sequence), and 9cR+2F (for Inv1 sequence). The int1h-2 was amplified in three PCR tubes including different primers, 2F+2R+9F, 2F+2R (for wild type sequence), and 2R+9F (for Inv1 sequence). The boy showed same pattern of int1h-1 with Inv1 patient, but had same pattern of int1h-2 with healthy control. This result confirmed the presence of inversed int1h-1. C, MLPA was performed to detect duplication and deletion within the exonic regions of the F8 gene. The ratio between 0.75 and 1.25 was considered as normal.
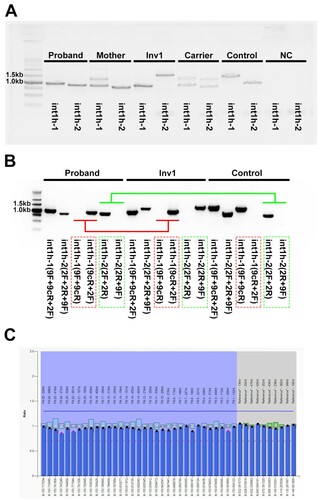
Figure 3. Coverage analysis of the WGS data. A, A large deletion crossing X:154235303-154237171 (hg19) was found in the boy. B, A large duplication including X:154259274-154376426 (hg19) was identified by the coverage analysis. C, The genomic regions of int1h-1 and int1h-2 amplified using 9F+9cR and 2F+2R respectively. The red dotted line labeled int1h-1 or int1h-2, and the bottom region was the almost identical region.
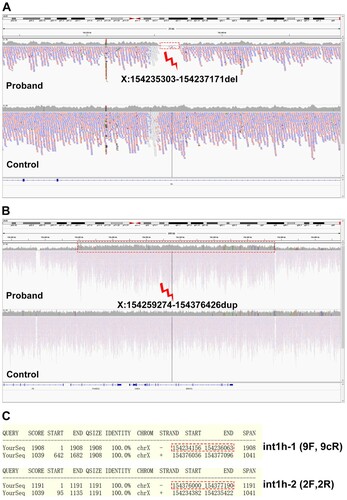
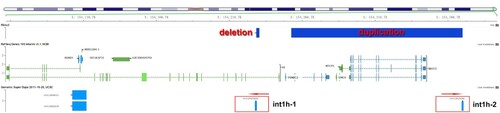
Figure 4. Hypothetical arrangement of the X chromosome in the patient. The deletion occurred in X:154235303-154237171 involving int1h-1. The duplication occurred in X:154259274-154376426 involving int1h-2.