Figures & data
Table 1. Clinical characteristics of study patients.
Figure 1. (A) Elevated WBC values between initial treatment and the first liver impairment occurred; (B) elevated GGT level between initial treatment and the first liver impairment occurred.
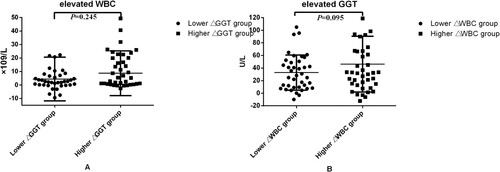
Figure 2. (A) Elevated WBC values between initial treatment and the first liver impairment occurred; (B) elevated GGT level between initial treatment and the first liver impairment occurred.
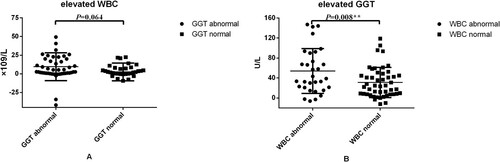
Table 2. Analysis of correlations between variations in enzymes levels.
Figure 3. Liver enzymes in all patients: liver enzymes’ variation tendency in all patients. Hepatoprotective agents were used in some patients when liver enzymes were abnormal during ATO treatment process. initiation, the initiation of ATO treatment; W1,one week after ATO treatment; W2, two weeks after ATO treatment; W3, three weeks after ATO treatment; W4, four weeks after ATO treatment; withdrawal, withdrawal of ATO treatment and the last biochemical parameters measurement during the treatment.
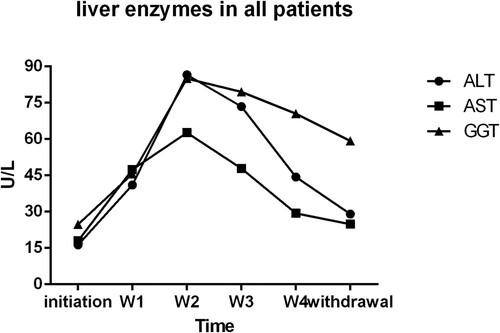
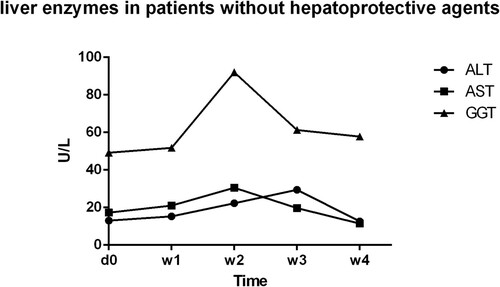
Figure 4. Liver enzymes in patients without hepatoprotective agents: liver enzymes’ variation tendency in patients whose ALT and AST level were normal during the treatment process, no matter GGT levels were abnormal or not; d0,before ATO treatment; W1,one week after ATO treatment; W2, two weeks after ATO treatment; W3, three weeks after ATO treatment; W4, four weeks after ATO treatment.