
Figures & data
Figure 1. Overall survival (OS) analysis of CD56 in intermediate-risk acute myeloid leukemia (IR-AML) in the GSE12417-GPL96 (A), the Cancer Genome Atlas (TCGA) (B) and GSE71014-GPL-10558 (C) datasets. The optimal cut-off values for CD56, and survival time distribution (middle panel) and Kaplan-Meier curves (right panel) based on the expression levels of CD56 are shown. CI, confidence interval.
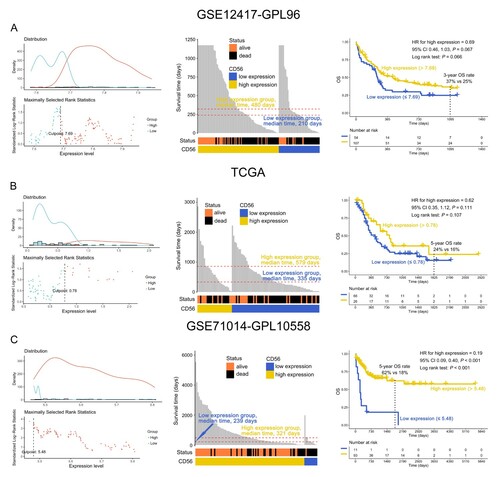
Figure 2. The restricted mean survival time (RMST) of IR-AML patients according to the expression levels of CD56 in the GSE12417-GPL96 (A), TCGA (B), and GSE71014-GPL-10558 (C) datasets.
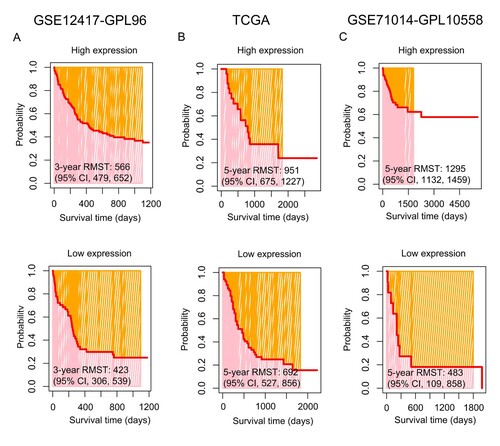
Table 1. Clinical information of patients with intermediate-risk acute myeloid leukemia.
Data availability statement
The datasets used and analyzed during this study are available from UCSC XENA platform (https://xenabrowser.net/datapages/) and GEO database (https://www.ncbi.nlm.nih.gov/geo/). The data that support the findings of this study are available from the corresponding author upon reasonable request.