Figures & data
Table 1 Patient and transplant characteristics.
Figure 1. Overall survival after allogeneic hematopoietic cell transplants using FBM regimen. (A) Survival rate for the entire cohort. (B) Survival rates stratified by the disease risk groups.
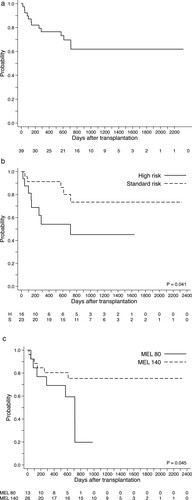
Table 2 Univariable and multivariate analyses for pretransplant variables potentially associated overall mortality.
Figure 2. Cumulative incidence of neutrophil engraftment after FBM regimen. (A) Incidence rate of neutrophil engraftment by types of graft source. (B) Incidence rate of neutrophil engraftment separated by the MEL140 and MEL80 groups.
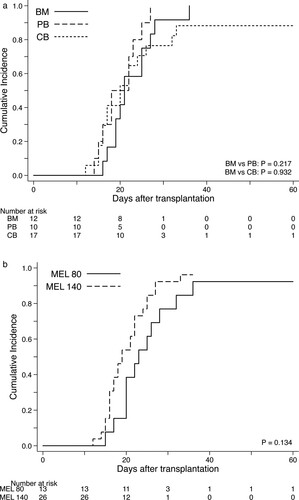
Figure 3. Cumulative incidence of acute and chronic GVHD according to types of graft source. (A) Incidence of grade II to IV acute GVHD within 100 days after transplantation. (B) Incidence of grade III or IV acute GVHD within 100 days after transplantation. (C) Incidence of chronic GVHD of any severity by NIH criteria.
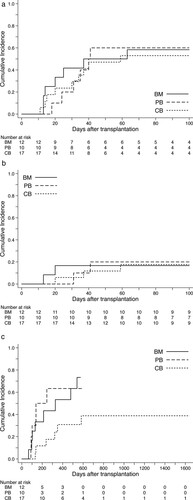
Table 3 Incidence of grade 3–4 regimen toxicities, VOD/SOS and TMA within 28 days after transplant.
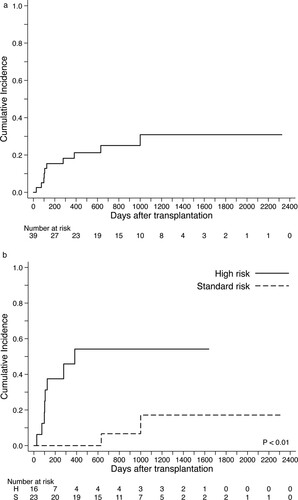
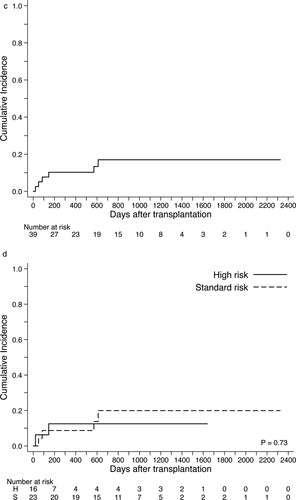
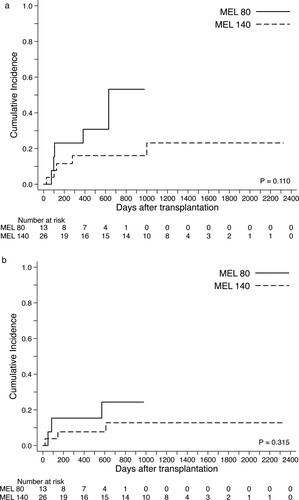
Figure 5. Cumulative relapse incidence and non-relapse mortality in the MEL140 and MEL80 groups. (A) Relapse incidence (B) Non-relapse mortality