Figures & data
Table 1. Clinical and laboratory features of patients with acute promyelocytic leukaemia diagnosed at Auckland City Hospital from February 2000 to January 2017.
Figure 1. Age distribution and survival of New Zealand Polynesian and European patients with acute promyelocytic leukaemia (APL). (A) Age at diagnosis of APL patients diagnosed at Auckland City Hospital (A–i) and recorded in the New Zealand Cancer Registry (A–ii) during 2000–2017. Bars indicate numbers of Polynesian patients (n = 16 in Auckland [i] and n = 46 in New Zealand [ii]) and European patients (n = 39 in Auckland [i] and n = 127 in New Zealand [ii]) categorized by their age at diagnosis. (B) Kaplan-Meier curves comparing cumulative survival probability between Polynesian and European patients with APL treated in Auckland City Hospital (B–i) and recorded in the New Zealand Cancer Registry (B–ii) from 2000–2017.
![Figure 1. Age distribution and survival of New Zealand Polynesian and European patients with acute promyelocytic leukaemia (APL). (A) Age at diagnosis of APL patients diagnosed at Auckland City Hospital (A–i) and recorded in the New Zealand Cancer Registry (A–ii) during 2000–2017. Bars indicate numbers of Polynesian patients (n = 16 in Auckland [i] and n = 46 in New Zealand [ii]) and European patients (n = 39 in Auckland [i] and n = 127 in New Zealand [ii]) categorized by their age at diagnosis. (B) Kaplan-Meier curves comparing cumulative survival probability between Polynesian and European patients with APL treated in Auckland City Hospital (B–i) and recorded in the New Zealand Cancer Registry (B–ii) from 2000–2017.](/cms/asset/0553d02d-14f8-4f5f-918d-b5cac62a51ef/yhem_a_1882146_f0001_oc.jpg)
Table 2. Time to treatment (ATRA and chemotherapy), bleeding/thrombotic events, and transfusion requirements during induction.
Table 3. Long-term outcomes of patients with acute promyelocytic leukaemia treated at Auckland City Hospital.
Table 4. Epidemiological data for patients with acute promyelocytic leukaemia recorded in the New Zealand Cancer Registry.
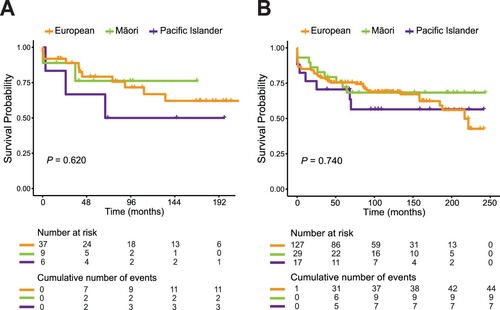
Figure 2. Overall survival of European, Māori and Pacific Island patients with acute promyelocytic leukaemia (APL). Kaplan-Meier curves comparing cumulative survival probability between European, Māori and Pacific Island patients with APL treated in Auckland City Hospital (A) and recorded in the New Zealand Cancer Registry (B) between 2000 and 2017.