
Figures & data
Figure 1. Distribution of the abundance ratios of 22 immune cells. (A) The abundance ratio of immune cells in the 148 samples. Each column represents a sample, and each column with a different color and height indicates the abundance ratios of immune cells in this sample. (B) The relationship between the abundance ratios of various immune cells. The value represents the correlation value. Red represents a positive correlation, and blue represents a negative correlation.
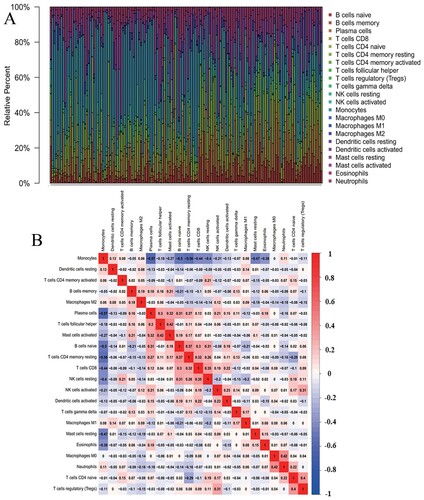
Figure 2. Associations between 22 tumor-infiltrating immune cells and patients survival. Kaplan-Meier survival analysis was used, and the red line indicates a high expressing group of immune cells, and the blue line indicates a low expressing group of immune cells.
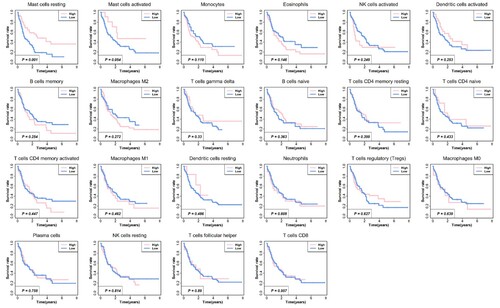
Figure 3. Identifying differentially expressed genes for different kinds of mast cells. (A-C) Volcano plots of three different kinds of mast cells. |log2(FC)| > 1.5 and P < 0.05 were set as the cut-off value. The up-regulated 10 genes and down-regulated 10 genes with the most significant differences were labeled. (D) The Venn calculation result was shown via diagrphVENN R package. There are 135 common genes related to mast cells infiltration.
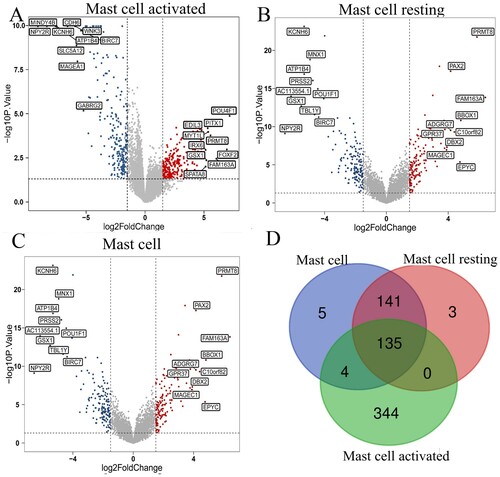
Figure 4. Enrichment analysis of genes related to mast cells infiltration. A–D represent the enrichment analysis results of genes involved in immune cell infiltration, namely biological processes, cellular components, molecular functions, and KEGG. The main 12 results of each term are shown, and the color indicates the significant degree of enrichment and the size indicates the number of genes enriched for each result.
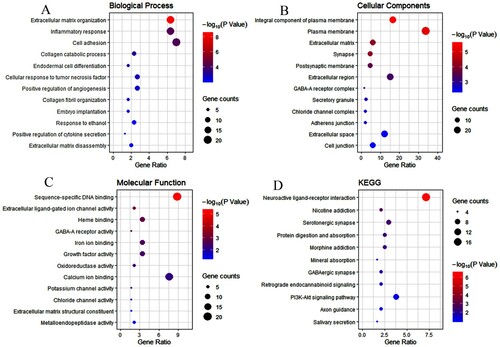
Figure 5. Gene Set Enrichment Analysis (GSEA) for the mast cells of AML microenvironment. Green lines indicate the Enrichment score of each gene set. The P-value was obtained by 1,000 iterations of sample-shuffling. AML, Acute myeloid leukemia; NES, new enrichment score; FDR, false discovery rate.
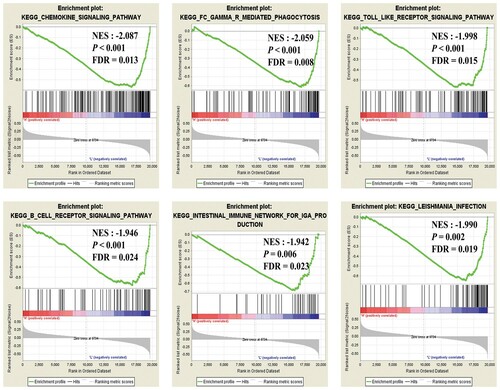
Table 1. Functional roles of the six hub genes.
Figure 6. Survival analysis for six hub genes. Kaplan-Meier survival analysis was performed. The red line indicates a high expressing group of gene expressions, and the blue line indicates a low expressing group of gene expressions.
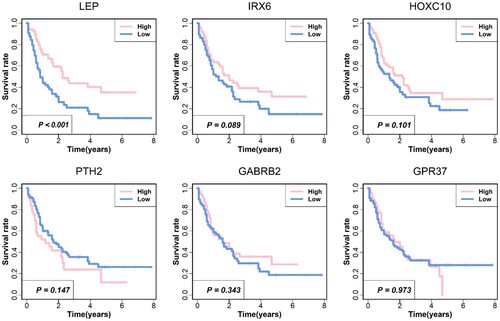
Figure 7. Correlation analysis between the six hub genes and mast cells. The three columns represent mast cells, mast cells resting and mast cells activated, and the six rows represent six genes respectively. The linear relationship was analyzed by Pearson correlation analysis.
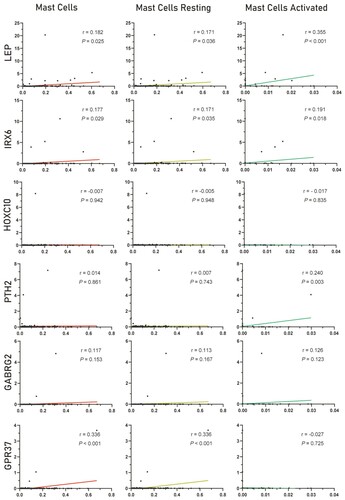
Figure 8. Chemical formulas of six most significant small molecule drugs. NU-1025, ketoconazole and antazoline are potential therapeutic drugs to AML, while butein, 2,6-dimethylpiperidine and cholecalciferol are opposite. Structural formulas for each small molecule drug are shown in the figure, with the name and molecular formulas (MF) of the corresponding small molecule drug marked under each figure.
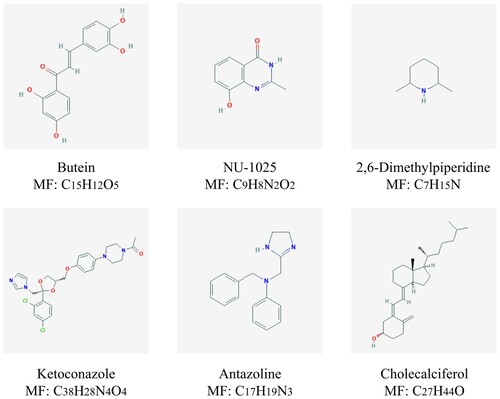
Table 2. The potential small molecule drugs of the CMap database.