
Figures & data
Table 1. Clinical characteristics and initial investigations.
Table 2. Sites of gastrointestinal involvement, lymphoma subtypes, and treatments.
Figure 1. Overall survival curves of PGIL.
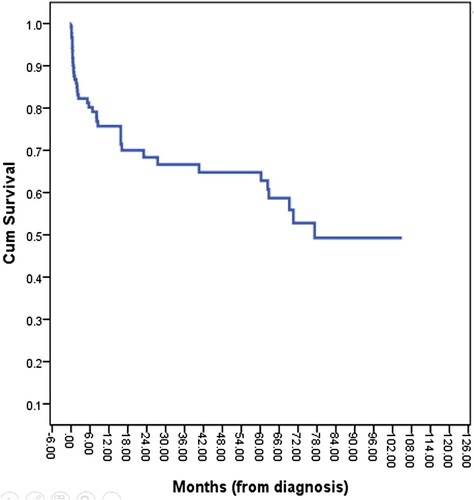
Figure 2. Overall survival curves according to (A) age groups (P-value = 0.352); (B) ECOG-PS (P-value = 0.015).
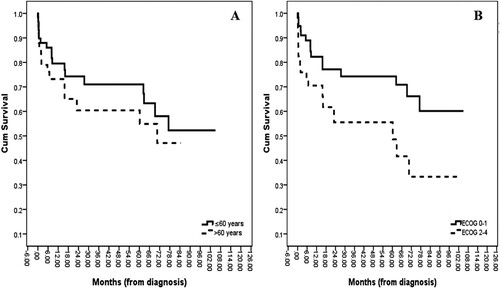
Figure 3. Overall survival curves according to (A) sites of lymphoma involvement (P-value = 0.036); (B) Staging groups (P-value = 0.528).
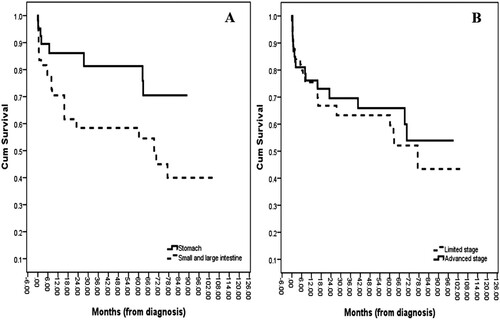
Figure 4. Overall survival curves according to (A) lymphoma groups (P-value = 0.005); (B) Rituximab exposure groups (P-value = 0.128).
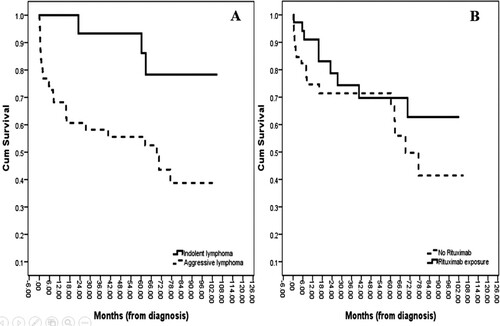
Table 3. Univariate and multivariate analyses for overall survival in PGIL patients (months).
Supplemental material