
Figures & data
Table 1. Clinical characteristics of 114 patients before transplantation.
Table 2. Comparison of observation indexes after transplantation.
Figure 1. Kaplan–Meier curves of (A) overall survival (OS), (B) progression-free survival (PFS), (C) cumulative incidence of relapse between the MRD+ group and MRD− group.
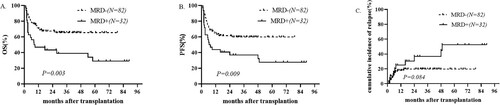
Figure 2. Kaplan–Meier curves of (A) non-relapse mortality (NRM), (B) GVHD/Relapse-Free survival (GRFS) between the MRD+ group and MRD− group.
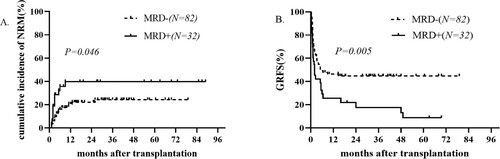
Table 3. Analysis of risk factors for OS.