
Figures & data
Table 1. Baseline characteristics of patients (n = 62).
Figure 1. Kaplan–Meier curves of 1-year relapse-free survival of acute myeloid leukemia patients in intermediate-dose cytarabine (IDAC) and high dose cytarabine (HiDAC) groups.
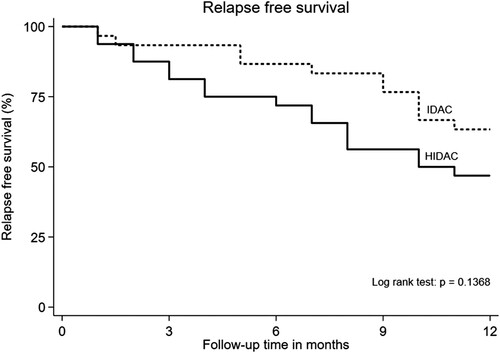
Figure 2. Kaplan–Meier curves according to the 1-year overall survival of acute myeloid leukemia patients in intermediate-dose cytarabine (IDAC) and high dose cytarabine (HiDAC) groups.
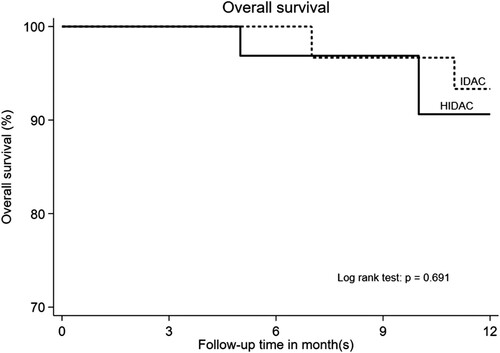
Figure 3. Kaplan–Meier curves of 2-year relapse-free survival of acute myeloid leukemia patients in intermediate-dose cytarabine (IDAC) and high dose cytarabine (HiDAC) groups.
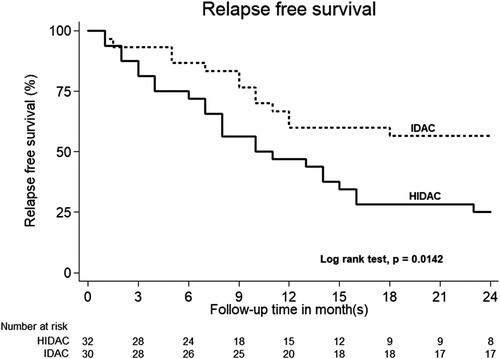
Figure 4. Kaplan–Meier curves according to the 2-year overall survival of acute myeloid leukemia patients in intermediate-dose cytarabine (IDAC) and high dose cytarabine (HiDAC) groups.
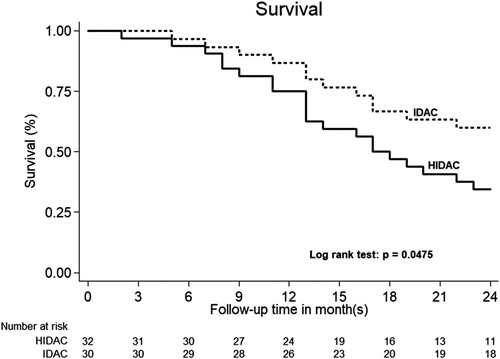
Figure 5. Comparison of duration of Grades 3–4 thrombocytopenia in each cycle between intermediate dose (IDAC) and high dose cytarabine (HiDAC) consolidation chemotherapy. (P = 0.045); GM: geometric mean.
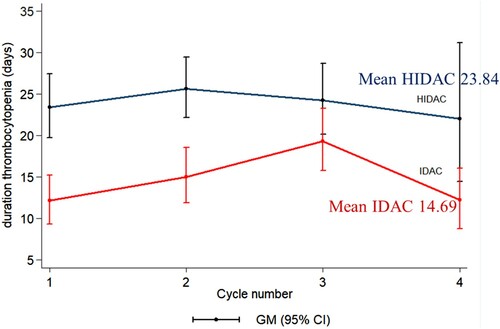
Table 2. Adverse events in each cycle of high-dose and intermediate-dose cytarabine for consolidation therapy.