
Figures & data
Figure 1. T cell receptor gamma alternative reading frame protein (TARP) expression is significantly increased in acute promyelocytic leukaemia (APL, M3 subtype) than in other acute myeloid leukemia (AML) subgroups (M0–M7 except for M3), based on analysis using the UALCAN online platform.
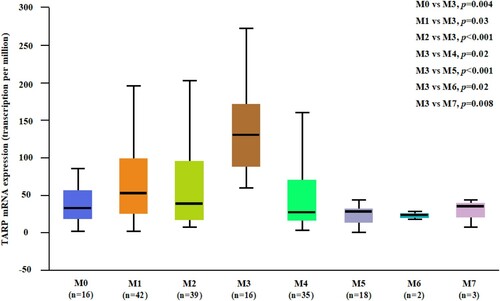
Figure 2. High TARP expression is related to high frequency of Fms-like tyrosine kinase (FLT3) alterations in non-APL patients, especially non-adolescents and young adults (AYA) AML patients. (A–F). Analysis of FLT3 mutations in low and high TARP groups of the total population, AYA subgroup and non-AYA subgroup (on the basis of the datasets GSE425 and GSE6891 downloaded from GEO). (G). Analysis of FLT3-internal tandem duplication (ITD) mutations in low and high relative TARP mRNA groups of non-AYA AML at our institute. (H–I). Composition of chromosomal karyotypes in low and high TARP groups based on analysis of the GSE425 and GSE6891 datasets. wt: wild type; mut: mutation.
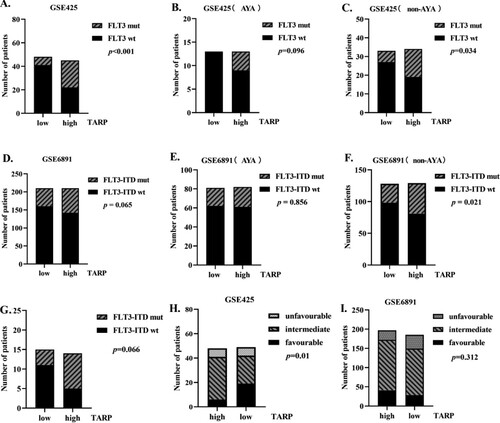
Table 1. Baseline characteristics of non-APL AML in low and high TARP arms of the GSE425 dataset.
Figure 3. High TARP levels are correlated with poor therapeutic response in non-APL AML subgroup, especially in non-AYA subgroup. (A–C). Therapeutic response of low and high TARP groups of the total population (A), AYA subgroup (B) and non-AYA subgroup (C) (GSE425). (D and E). Therapeutic response of low and high TARP arms in autologous-Hematopoietic stem cell transplantation (HSCT) and allogeneic-HSCT subgroups of the dataset GSE425. CR: complete remission; R/R: Relapsed/Refractory.
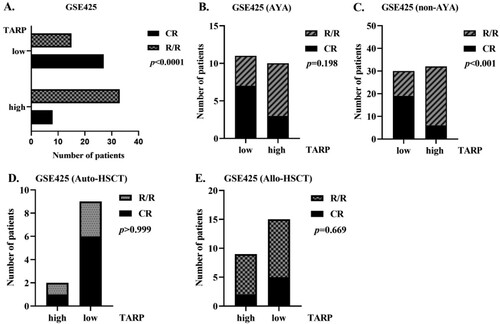
Figure 4. High TARP levels were associated with poor overall survival (OS) and progression-free survival (PFS) in non-APL AML cases, especially in non-AYA cases. (A–C). OS curves (GSE425); (D–F). PFS curves (GSE425); (G–H). OS and PFS of non-AYA AML patients with low- and high-relative TARP mRNA at our institute.
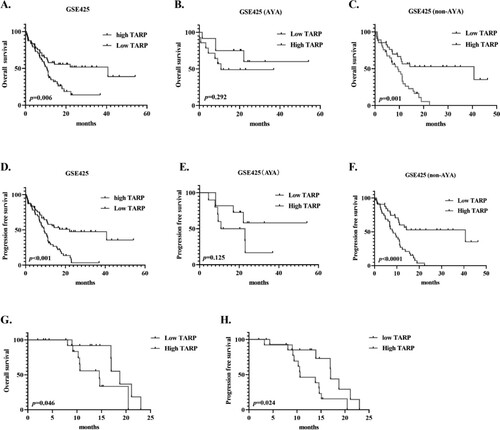
Table 2. Univariate and multivariate analyses of risk factors for OS in AML in the GSE425 dataset.