Figures & data
Table 1. The clinical characteristics of SAA patients (n=287).
Figure 1. Frequency and outcome of mixed chimerism (MC) based on (A) time of onset and (B) initial MC levels. Level 1, <10%residual host cells (RHCs); level 2, 10-25% RHCs; level 3, >25% RHCs. Dynamic changes in MC were monitored. The left panel of (B) shows the initial MC levels and the right panel the final MC level. In (B), the left side of picture B is the initial chimerism when MC appeared, we tracked the dynamic changes of chimerism of these patients. The right side of the picture shows the final outcome of chimerism.
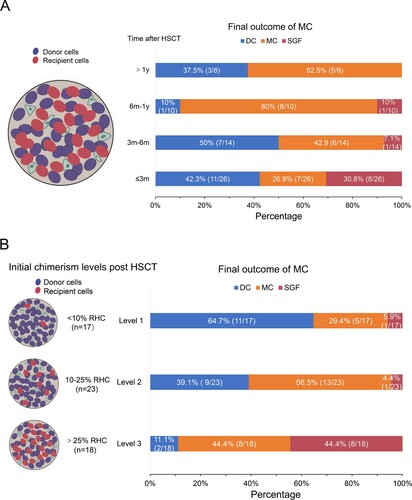
Figure 2. Prognostic analysis of aplastic anemia (AA)patients with different chimerism statuses following allogeneic hematological stem cell transplantation (allo-HSCT). (A) Distribution of survival time (left panel) and curves (right panel) of AA patients. (B) restricted mean survival time (RMST) of patients with severe aplastic anemia (SAA) with different chimerism statuses following allo-HSCT. Group 1, donor chimerism (DC); group 2, mixed chimerism (MC) without cytopenia; group 3, MC with cytopenia; group 4, secondary graft failure (SGF). OS, overall survival.
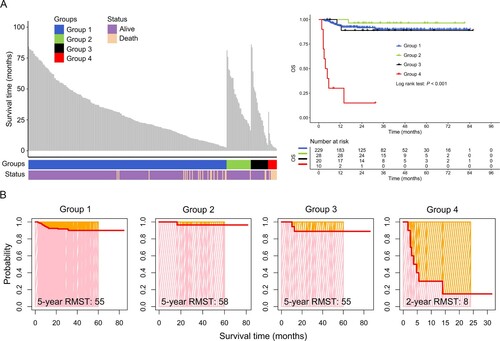
Table 2. Risk factors for MC patients without transfusion dependence.
Table 3. Risk factors for MC patients with transfusion dependence.
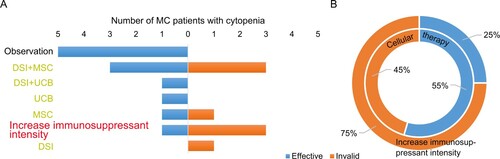
Figure 3. Therapeutic effect of patients with MC with cytopenia or SGF following allo-HSCT. (A) Patient response to different treatments. (B) Patient response to increase immunosuppressant intensity and cellular therapy. donor stem cell infusion (DSI), mesenchymal stem cell (MSC) and umbilical cord blood stem cell (UCB) were part of cellular therapy. Inside circle, cellular therapy; outside circle, increase immunosuppressant intensity.