Figures & data
Figure 1. Identification of differentially expressed genes in two GE profiles (GSE80140 and GSE80545). (a) Respective volcanic maps of the two datasets. Up (red plots), the expression is up-regulated; down (green plots), the expression is down-regulated; no (gray plots), no significantly dysregulated. (b) Heatmaps of top 50 dramatically altered genes of DEGs in GSE80140 and GSE80545. (C) Commonly changed DEGs in the two datasets (119 up – and 67 down-regulated genes). DEGs, differentially expressed genes.
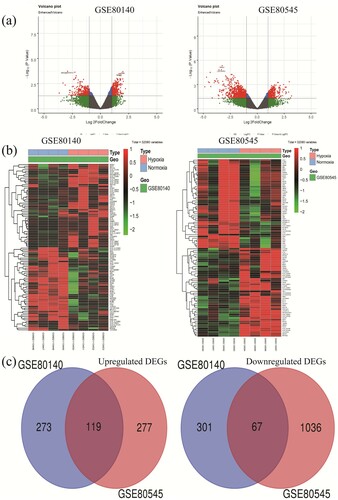
Figure 2. GO and KEGG enrichment analysis of DEGs. (a) GO analysis including BP, MF, and CC three subontologies. (b) KEGG pathway enrichment analysis. GO, gene ontology; KEGG, Kyoto Encyclopedia of Genes and Genomes; DEGs, differentially expressed genes; BP, biological process; MF, molecular function; CC, cellular component.
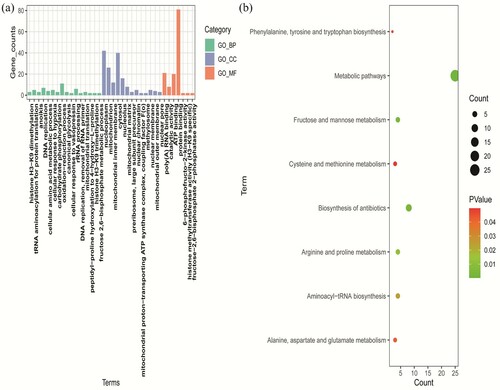
Table 1. Top 5 enriched terms of GO analysis.
Table 2. DEGs identified from GO and KEGG analysis.
Figure 3. PPI network analysis. (a, b) The PPI analysis at STRING. (c, d) Cytoscape plug-ins cytoHubba analysis of candidate genes after PPI analysis. (a, c) Genes identified from GO analysis. (c, d) Genes identified from KEGG analysis. PPI, protein–protein interaction.
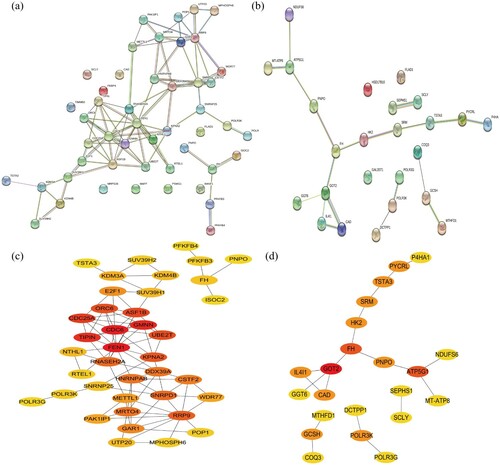
Table 3. The genes with the score of each analysis through the Cytoscape ‘cytoHubba’ module analysis
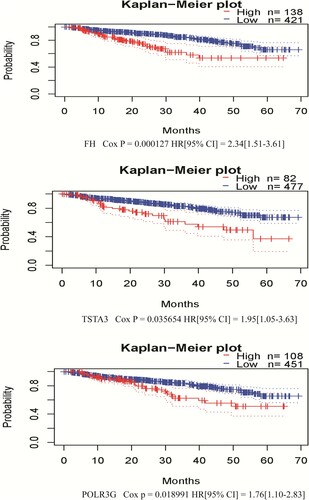
Figure 4. Correlation between individual statistically significant DEG expression and DSS in MM. Kaplan–Meier survival curves comparing high and low expression of DEGs in MM in PrognoScan, as based on the GSE2658 dataset (n = 559). Cox p < 0.05 was considered as statistically significant. DEGs, differentially expressed genes; DSS, disease-specific survival; MM, multiple myeloma.