Figures & data
Figure 1. Heat maps of potential cell types in PMF and control groups, (a): cell types of GSE61629 dataset; cell types of GSE 26049 dataset; (b): the corporate cell types in the GSE61629 and GSE26049 datasets.(c): volcano plot of DEGs in GSE61629 dataset; (d): volcano plot of DEGs in GSE26049 datasets; (e): heat map of the top 40 DEGs in GSE61629 dataset; (f): heat map of the top 40 DEGs in GSE26049 dataset.
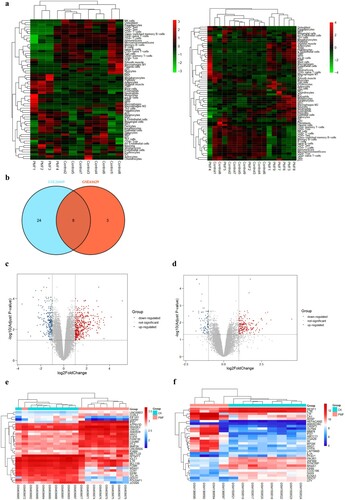
Figure 2. Functional and pathway enrichment analyses of DEGs, (a): Venn diagram displays the common DEGs in the GSE61629 and GSE26049 datasets; (b): the enrich circle plot presents the top 20 most remarkable enriched GO terms, different color module represents various term; (c): the bubble plot reflects the result of KEGG pathway analysis.
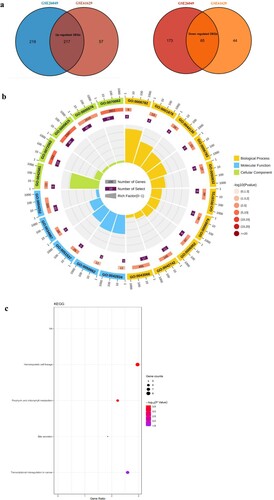
Figure 3. PPI network and hub gene selection, (a): PPI network of 282 DEGs; (b): five topological analysis methods based on CytoHubba; (c): Venn plot reflects the intersected hub genes based on five taxonomic methods.
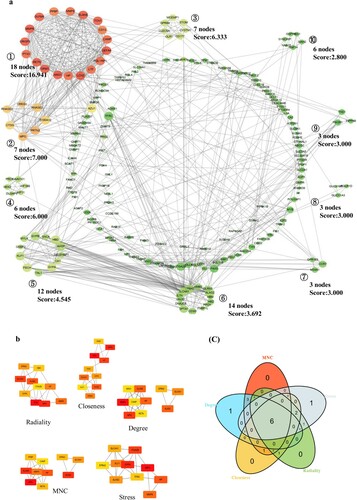
Figure 4. Characteristics of six hub genes, (a): the expression of each hub gene in the two datasets; (b): the correlation chordal graph of hub genes; (c): ROC curve of each hub genes; (d): the correlation heat map of hub genes and significant immune cells.
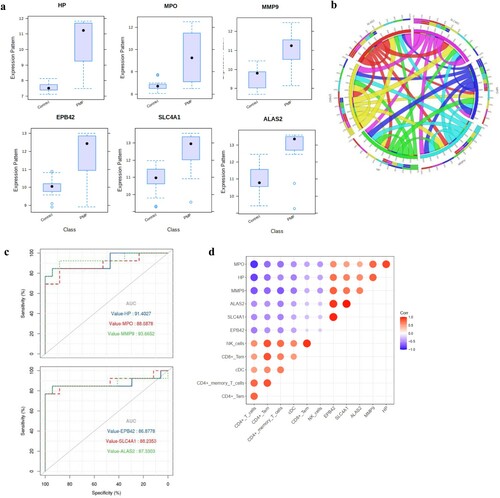
Figure 5. Correlation between hub genes and significant immune cells. The level of association was examined with Pearson's correlation coefficients.
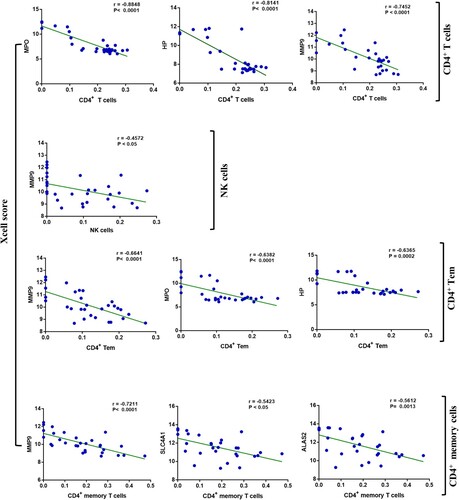
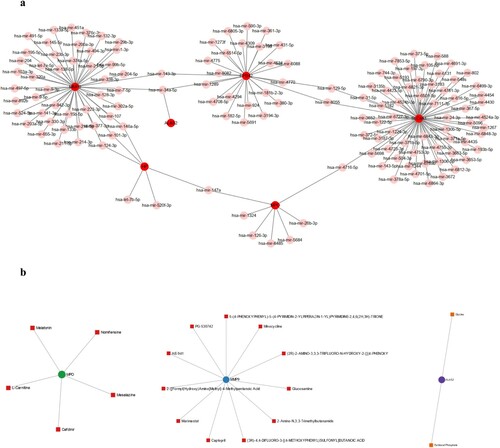
Figure 6. The miRNA regulatory and potential drug network of hub genes, (a): the miRNA regulatory network, hub genes were marked with red color; (b): the potential drug network of MPO, MMP9 and ALAS2.