Figures & data
Table 1. Clinical characteristics of the 108 newly diagnosed MM patients according to CPC expressions.
Table 2. Correlations between levels of CPC and patients’ clinical stages.
Figure 1. Kaplan–Meier curves showing the (A) overall survival (OS) and (B) progression-free survival (PFS) of patients with less than or more than 0.015% circulating clonal plasma cells (CPC) at the time of the diagnosis of multiple myeloma (MM).
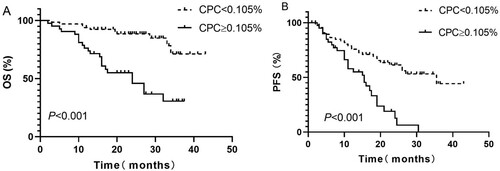
Figure 2. Kaplan–Meier curves showing the (A) overall survival (OS) and (B) progression-free survival (PFS) of patients who received upfront bortezomib-based treatment with less than or more than 0.015% circulating clonal plasma cells (CPC) at the time of diagnosis. C and D show OS and PFS, respectively, for patients who received IMiD-based therapy.
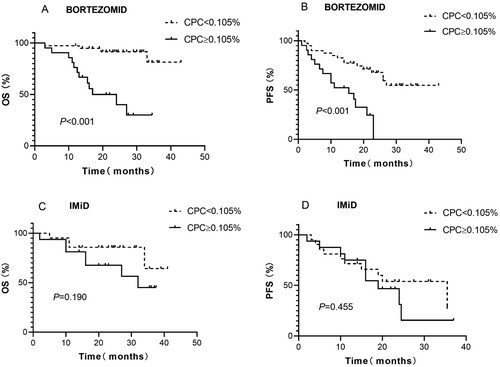
Figure 3. Kaplan–Meier curves showing the (A) overall survival (OS) and (B) progression-free survival (PFS) of evaluable patients with detectable or undetectable circulating clonal plasma cells (CPC) after treatment.
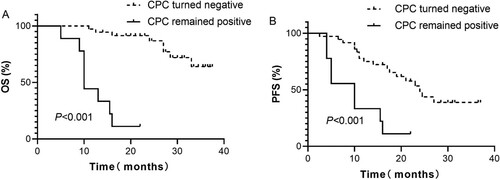
Table 3. Comparison of CPC expression and paired MRD of bone marrow.
Table 4. Univariate and multivariate COX analysis of factors predicting for OS and PFS.
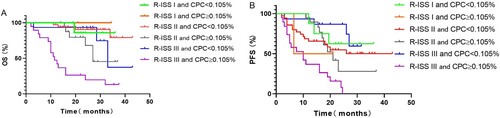
Figure 4. Kaplan–Meier curves showing (A) overall survival (OS) and (B) progression-free survival (PFS) according to R-ISS stages based on the level of circulating clonal plasma cells (CPC) level.