
Figures & data
Table 1. Sequence and length of target gene.
Figure 1. Proliferation rate of MUTZ-1 cells treated with Jervine (X ± SD, n = 3). A. Inhibitory effect of multiple concentrations of jervine on the proliferation of MUTZ-1 cells. B. The representation of the time- and dose-dependent effects of jervine on cell proliferation in MUTZ-1 cells. *P < 0.01.
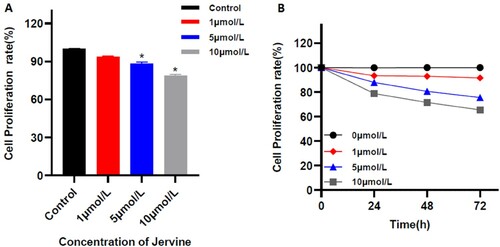
Figure 2. Proliferation rate of MUTZ-1 cells treated with DAC (X ± SD, n = 3). A. Inhibitory effect of multiple concentrations of DAC on the proliferation of MUTZ-1 cells. B. The representation of the time- and dose-dependent effects of DAC on the proliferation in MUTZ-1 cells. **P < 0.01.
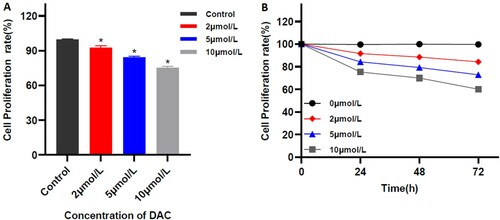
Figure 3. Comparison of cell Proliferation rate among the multiple groups. Jervine alone (5 μmol/L), DAC alone (5 μmol/L), and jervine and its combination with DAC (X ± SD, n = 3). **P < 0.01.
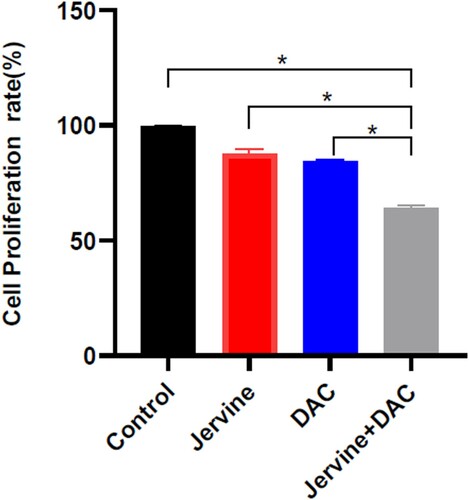
Figure 4. Combination effects of Jervine and DAC in MUTZ-1 cells (X ± SD, n = 3). The combination index of the two drugs on MUTZ-1 cells was less than 1, and the proliferation rate of the combination group was significantly lower than that of the single-drug group. J represents the Jervine intervention group, D represents the decitabine intervention group, J + D represents the combination group of jervine and decitabine.
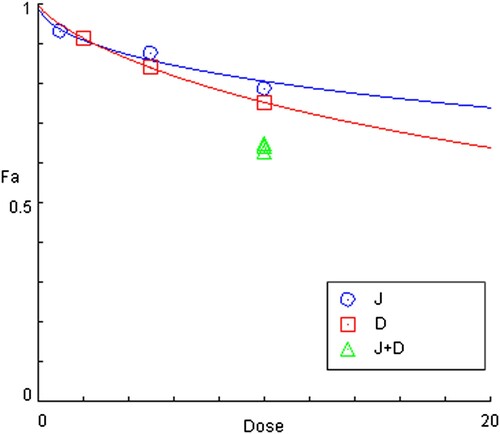
Figure 5. Jervine (5 μmol/L), decitabine (5 μmol/L), and their combined effects on cellular apoptosis. A. Comparative cell apoptosis rate after treatment with jervine, decitabine, and their combinations. B. MUTZ-1 cells were exposed to jervine, decitabine, and their combination at indicated concentrations for 24 h and apoptosis was determined by Annexin V-FITC/PI staining.
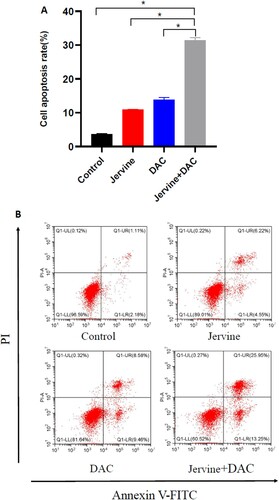
Figure 6. Comparison of the cell cycle after the intervention of jervine, decitabine, and their combination (Jervine 5 μmol/L, DAC 5 μmol/L) A. Cell cycle rate is increased in G1 phase but decreased in the S phase. B-E. MUTZ-1 cells were treated for 24 h and then flow cytometry was utilized to analyze the cell cycle.
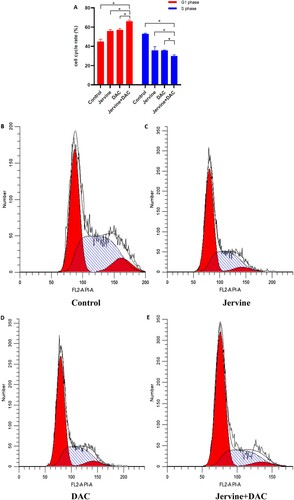
Figure 7. The relative mRNA expression levels of Smo and Gli-1. (Jervine 5 μmol/L, DAC 5 μmol/L), *p < 0.01; #p < 0.01; ♦p < 0.05.
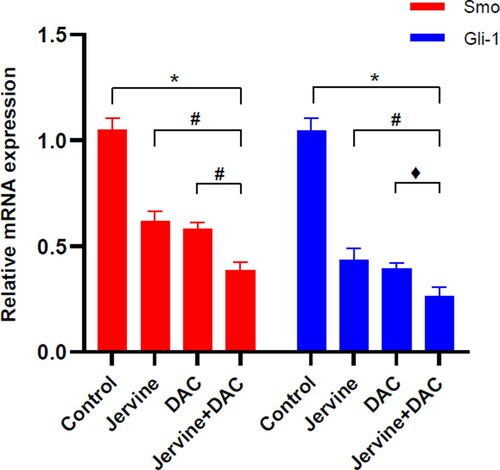
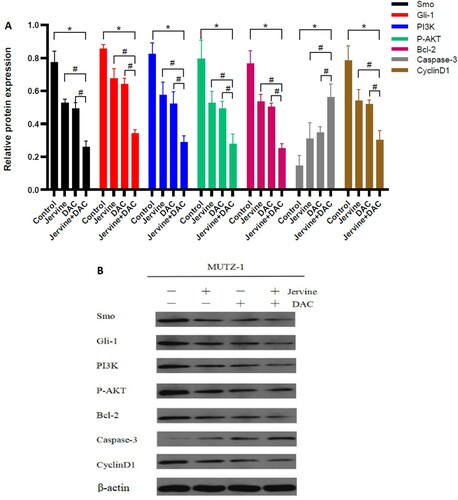
Figure 8. The relative expression levels of Smo, Gli-1, PI3 K, P-AKT, Bcl-2, Caspase-3, and Cyclin D1 protein after the intervention of jervine (5 μmol/L) and its combination with DAC (5 μmol/L) (n = 3). A. The Smo, Gli-1, PI3K, p-AKT, Bcl-2, and Cyclin D1 proteins are downregulated, and caspase-3 is upregulated after the treatment of jervine and DAC. B. Western blotting of Smo, Gli-1, PI3K, p-AKT, Bcl-2, Cyclin, and caspase-3 proteins indicating the differences among the different groups.
Data availability
All data utilized, produce, and analyzed during this study are included in this article.