
Figures & data
Table 1. Patients’ characteristics.
Figure 1. Anti-STC1 dose–response experiment. (A) Immunoblot showing STC1 in MSC/AML co-culture after adding PBS and 0.1, 0.2, 0.5, 2 μg/ml of anti-STC1 antibody. β-Actin served as control. (B) Quantification of the same Immunoblot as in (A) by showing the percentage of STC1 expression related to β-Actin.
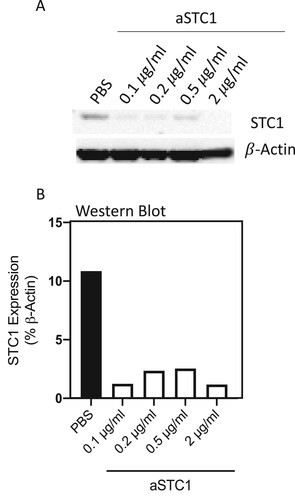
Figure 2. MSCAML need more time to expand in culture flasks than MSCHD. Absolute number of days BM-MSCAML (n = 21; AML samples 1–21) or -MSCHD (n = 31) needed to expand in 100 mm cell culture dishes (primary expansion) till 100% confluence was achieved and afterwards in 75 cm2 cell culture flasks (secondary expansion) till 80% confluence was achieved. Error bar = SEM; p (primary) = 0.6; p (secondary) = 0.03.
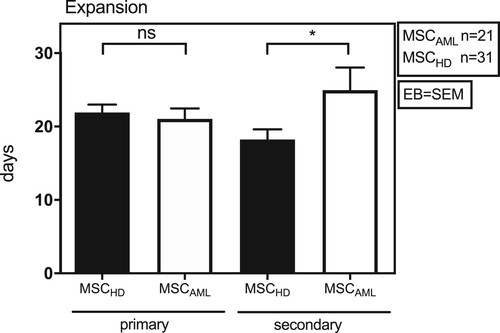
Figure 3. MSCAML present a different gene expression profile compared to MSCHD with STC1 being mostly overexpressed in MSCAML. (A) Heat map of differentially expressed genes (p < 0.05) among MSC and AML blasts. Red and blue colors designate increased and decreased expression, respectively. (B) Fold change gene expression signal of genes which were known to be implicated in the BM niche and which were significantly over- or underexpressed in MSCAML compared to MSCHD. (C) STC1 log2 signal in MSCAML (n = 3; AML samples 3–5) compared to MSCHD (n = 3) and AML blasts (n = 3; AML samples 3–5). Error bar = SEM, p (MSCAML vs. MSCHD) = 0.03; p (MSCAML vs. AML blasts) = 0.001; p (MSCHD vs. AML blasts) = 0.004. (D, E) Quantitative RT-PCR of STC1 mRNA in 3 MSCHD and 5 MSCAML. Results are relative to GAPDH. PDGF = Platelet Derived Growth Factor, EFNA5 = Ephrin A5, ITGA10 = Integrin Alpha 10, CD9 = Cluster of Differentiation 9, COL4A1 = Collagen Alpha 1 (IV) chain, STC1 = Stanniocalcin 1, TNFRSF10D = Tumor Necrosis Factor Receptor Superfamily Member 10D, IER3 = Immediate Early Response 3, TRPV2 = Transient Receptor Potential Cation Channel Subfamily V member 2, BRD2 = Bromodomain-containing protein 2.
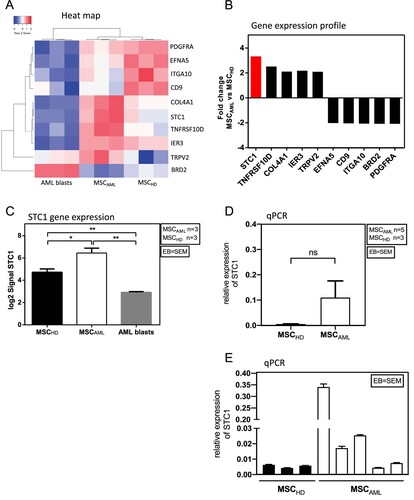
Figure 4. MSCAML secrete higher amounts of STC1 than MSCHD. Soluble STC1 (sSTC1) concentration (pg/ml) was determined by ELISA in mono-culture supernatant of MSCAML (n = 8; AML samples 8–14 and 27) compared to MSCHD (n = 7) with duplicate measurements, data are presented as mean +/− SEM; p = 0.0412.
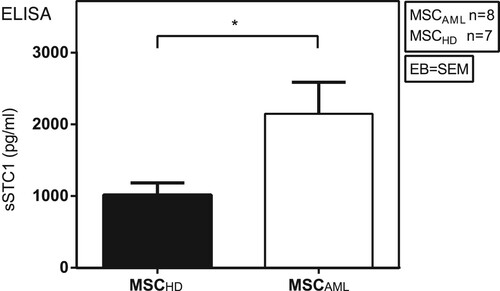
Figure 5. STC1 expression is increased in the BM from AML patients compared to HD. Representative immunohistology staining of STC1 (brown) on AML patient (A; AML sample 22) and HD (B) derived BM sections as compared to isotype control (C, D). 100× magnification.
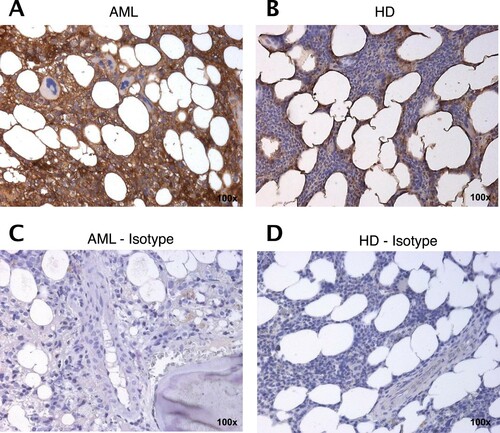
Figure 6. Reciprocal stimulation of human BM MSC in co-culture with AML cells. Representative electron microscopy images of co-cultured MSC and AML cells. (A) Tight cell to cell collocation of MSC (white asterisk) and AML blast (red arrow; AML sample 23) recognized in co-culture conditions after two weeks. A remarkable amount of secretory vesicles can be identified within the MSC cytoplasm. In higher resolutions (B, C) multiple protrusions (x) were obvious, but no evidence of tight junctions. (D) MSC in mono-culture after one week with obvious appearance of lipid inclusions (brown Y), myelin like inclusions (command sign) and phagocytes (green arrow), indicating senescence. (E) MSC in mono-culture after two weeks with cytoplasmic dissolution, indicating cell disintegration (minus symbol inside a circle).
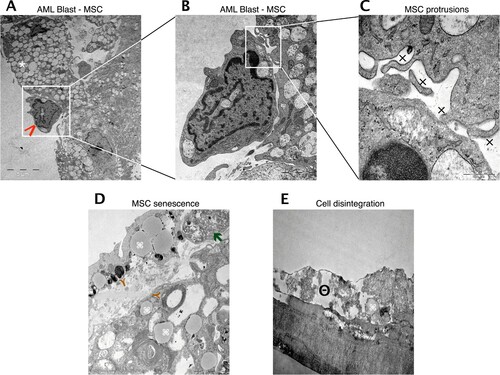
Figure 7. Blockade of STC1 had no effect on proliferation and apoptosis of AML cells. (A, B) Absolute number of successive generations (G1–G6) of AML cells (3 patients: AML samples 24–26), co-cultured with MSCAML (n = 3) ± anti-STC1 vs. MSCHD (n = 3) ± anti-STC1. Two-way ANOVA interaction between the row and the column factor: p = 0.28. (C) Representative zebra plot of CFSE stained AML cells from one patient. (D, E) Absolute count of apoptotic AML cells (3 patients: AML samples 24–26), co-cultured with MSCAML (n = 3) + anti-STC1 vs. MSCHD (n = 3) + anti-STC1, relative to the results of the control dishes. (F) Representative contour plot of Annexin V-FITC/PI stained AML cells from one patient. (G, H) Percentage of S/G2-phase AML cells (3 patients: AML samples 24–26), co-cultured with MSCAML (n = 3) ± anti-STC-1 vs. MSCHD (n = 3) ± anti-STC-1. (I) Representative histogram of PI stained AML cells from one patient. Percentage of cells in S-, G1- and G2-phase are displayed.
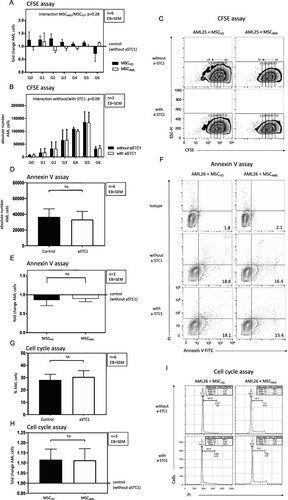
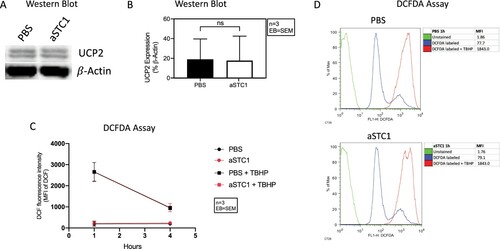
Figure 8. STC1 inhibition had no effect on UCP2 expression and ROS levels of AML cells. (A) Immunoblot showing UCP2 in MSC/AML co-culture after adding PBS and 0.1 μg/ml of anti-STC1 antibody. β-Actin served as control. (B) Quantification of the same Immunoblot as in (A) by showing the percentage of UCP2 expression related to β-Actin. (C) DCF fluorescence intensity 1 and 4 h after incubation with DCFDA ± TBHP. (D) Representative histogram depicting the DCF fluorescence intensity of unstained (green), DCFDA (blue) and DCFDA + TBHP (red) treated AML cells from one patient 1 h after addition of anti-STC1 to the MSC-AML cell co-culture.
Data availability statement
The data that support the findings of this study are openly available in figshare at https://doi.org/10.6084/m9.figshare.14465721.v1 [Citation30].