
Figures & data
Figure 1. (A) Kaplan-Meier plot of time to VGPR; (B) Progression-free survival (PFS) and overall survival (OS) for RRMM treated with 3-weekly dara-IMiD-dex regimen. (C) Swimmer plot of patients’ outcome. CR: complete response; VGPR: very good partial response; PR: partial response; SD: stable disease; PD: progressive disease.
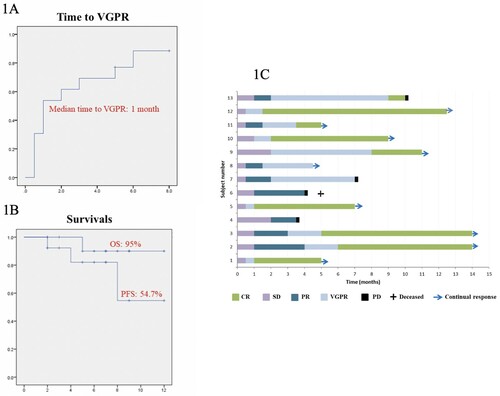
Figure 2. PET-ve CR based on the complete resolution of (i) diffuse hypermetabolic bone marrow lesions in the axial skeleton and both femurs (boxed), and (ii) focal hypermetabolic marrow lesions (red arrows) in the lumbar spine, L humerus and R iliac bone, at the time of serological CR (blue arrows).
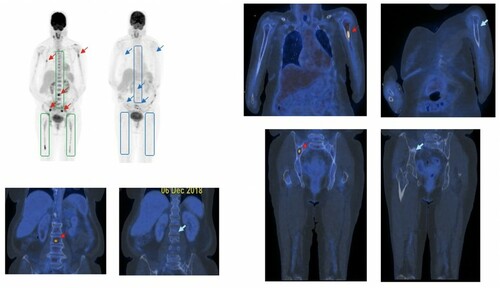
Table 1. Treatment-emergent adverse events.