Figures & data
Figure 1. Inclusion and Exclusion Criteria. We reviewed the medical records of 61 patients diagnosed with acute myeloid leukemia in the years 2015-2017 treated at Windsor Regional Hospital (WRH). Patients were included in the study if they received induction chemotherapy, and were either admitted to the Intensive Care Unit (ICU) during induction chemotherapy (ICU group) or were not (control group). Patients were excluded if they did not receive induction chemotherapy, if they were admitted to the ICU prior to initiation of induction chemotherapy, and if there were missing records.
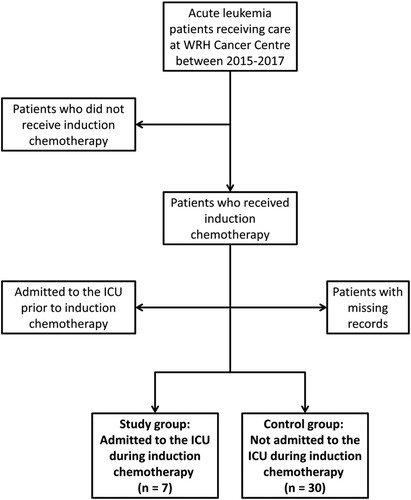
Table 1. Patient characteristics for ICU and control groups.
Figure 2. Reasons for ICU Admission: Cause for Intensive Care Unit (ICU) admission was interpreted based on ICU records; in some patients multiple reasons for admission were listed. ICU admission was predominantly related to respiratory failure.
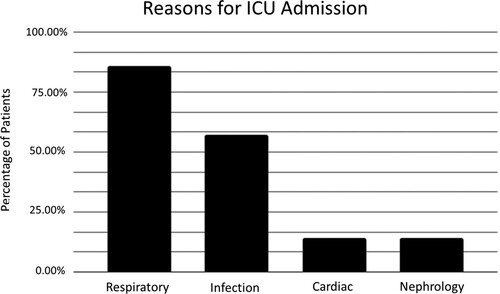
Figure 3. Average Number of Vitals Taken: There is no significant difference in the average number of times vital signs were taken over the 24 hour study period between the Intensive Care Unit (ICU) group and the control group (p = 0.07).
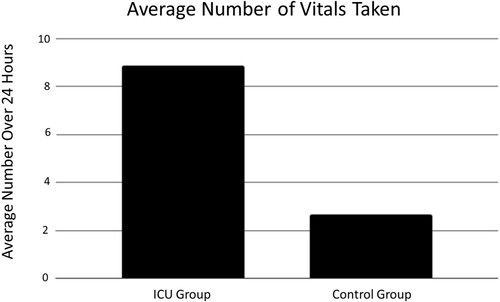
Figure 4. Isolated Missed Vital Signs: ‘Isolated missed vital signs’ refers to instances where a set of vitals taken at a certain point in time was missing one or more of the standard vital signs (blood pressure, heart rate, respiratory rate, oxygen saturation). Temperature was excluded from this analysis as it is not recorded on Intensive Care Unit (ICU) consult forms. Respiratory rate was recorded the least during 24 hours leading up to ICU admission, though this was not statistically significant (p = 0.87).
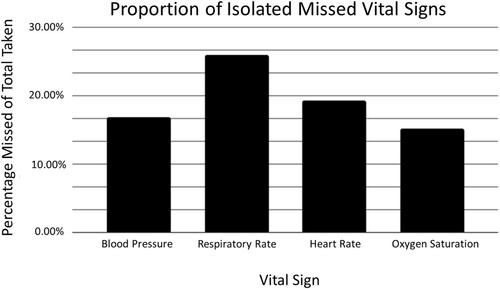
Table 2. Results of One-way ANOVA test, comparing the proportion of isolated missed vital signs for blood pressure (BP), respiratory rate (RR), heart rate (HR), and oxygen saturation (O2Sat).
Figure 5. Patient Vitals Over 24 Hours: Patient temperature (A), mean arterial pressure (MAP) (B), heart rate (C), respiratory rate (RR) (D) and fraction of inspired oxygen (FiO2) (E) as measured during the 24 hours prior to Intensive Care Unit (ICU) admission or 5 days post-induction chemotherapy initiation. Increases in RR (D) and FiO2 (E) occur in the 24 hours prior to ICU admission, but are not observed in the control group. Each line corresponds to a single patient, and each point corresponds to when the respective vital sign was checked by nursing staff. Control group, n = 30, ICU group, n = 7.
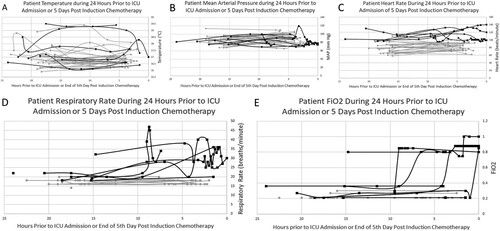
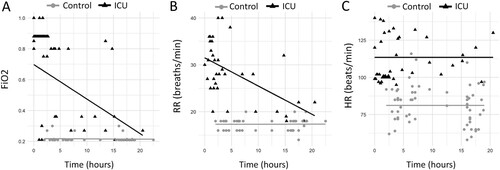
Figure 6. Changes in Vital Signs Over Time: Fraction of inspired oxygen (FiO2) (A) and respiratory rate (RR) (B) show significant increases from baseline over 24 hours prior to Intensive Care Unit (ICU) admission within the ICU group. Changes in heart rate (HR) (C) over the same time period is not significant within the ICU group. However, there were significant differences in FiO2 (A), RR (B) and HR (C) between the ICU group and control group at time zero (p<0.0001). Time zero is defined as the time of ICU admission in the ICU group, or midnight on day 5 post-induction chemotherapy initiation in the control group.