Figures & data
Table 1. The association of circ_0001821 expression with the clinicopathological characteristics in 115 multiple myeloma patients.
Figure 1. The expression of circ_0001821 in tissues and cell lines of multiple myeloma. (A) The expression levels of circ_0001821 were measured in bone marrow tissues from 115 multiple myeloma patients and normal controls by using quantitative real-time PCR. (B) Comparison of circ_0001821 expression in a normal peripheral blood mononuclear cell (PBMC) and four multiple myeloma cell lines (RPMI-8226, NCI-H929, JJN-3 and U266), and circ_0001821 was upregulated in the four multiple myeloma cell lines. **P < 0.01, ***P < 0.001.
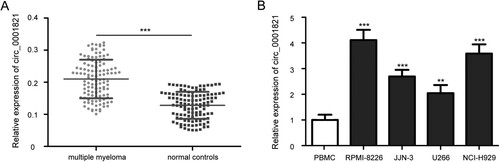
Figure 2. Upregulated circ_0001821 was associated with poor patient outcome. (A) The OS rate of multiple myeloma patients with low and high circ_0001821 expression was analyzed by the using Kaplan-Meier survival method, and the survival curves were evaluated with the log-rank test. (B) In patients with multiple myeloma aged ≥60 years, high circ_0001821 expression group displayed a shorter OS rate compared with the low circ_0001821 expression group. (C) In patients with multiple myeloma aged <60 years, there was no significant difference in the OS rate between the high and low circ_0001821 expression groups.
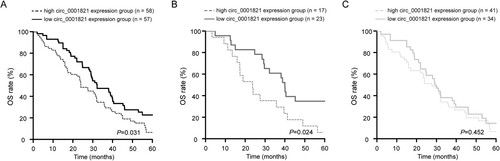
Table 2. Univariate and multivariate Cox regression analyses of clinicopathological characteristics as overall survival predictor in multiple myeloma patients.
Figure 3. Circ_0001821 stimulated the cell proliferation of multiple myeloma cells. (A) RPMI-8226 cells were treated with pcDNA4.0 and pcDNA4.0 + circ_0001821 for 48 h, and quantitative real-time PCR was applied to determine circ_0001821 expression. (B) The expression level of circ_0001821 was decreased in NCI-H929 cells after treatment with si-circ_0001821 compared with cells transfected with si-NC. (C) MTT assay showed that pcDNA4.0 + circ_0001821 promoted the cell proliferation in RPMI-8226 cells. (D) Knockdown of circ_0001821 reduced cell proliferation in NCI-H929 cells compared to the si-NC group. ***P < 0.001.
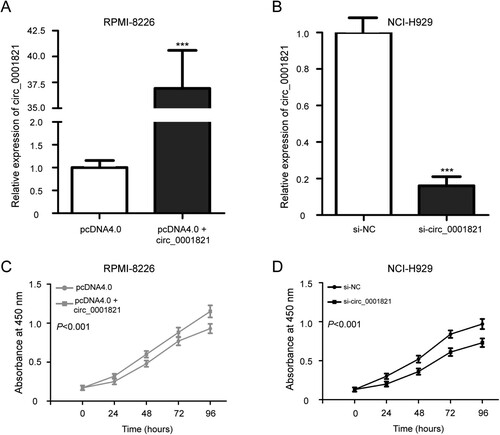
Figure 4. Circ_0001821 suppressed the cell apoptosis of multiple myeloma cells. (A) Cell apoptotic rate was detected with flow cytometry analysis in circ_0001821-overexpressed RPMI-8226 cells. Overexpression of circ_0001821 led to inhibit RPMI-8226 cell apoptosis. (B) NCI-H929 cells incubated with the si-circ_0001821 exhibited increased cell apoptosis compared to the si-NC group. ***P < 0.001.
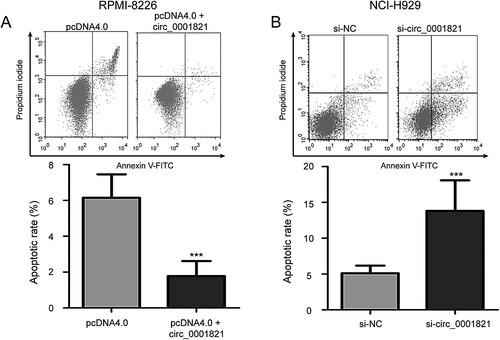
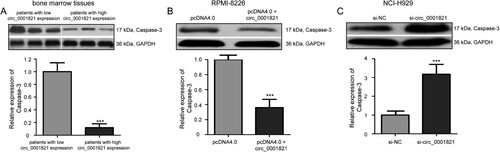
Figure 5. Circ_0001821 reduced Caspase-3 protein expression in multiple myeloma cells. (A) The Western blotting analysis of the expression level of Caspase-3 protein in bone marrow tissues with high and low circ_0001821 expression. (B) pcDNA4.0 + circ_0001821 could decrease Caspase-3 protein in RPMI-8226 cells compared with the si-NC group. (C) Caspase-3 protein expression was increased in NCI-H929 cells after treatment with si-circ_0001821 compared with cells treated with si-NC. ***P < 0.001.