
Figures & data
Figure 1. Study flow diagram. ITP, immune thrombocytopenia; TPO-RA, thrombopoietin receptor agonist.
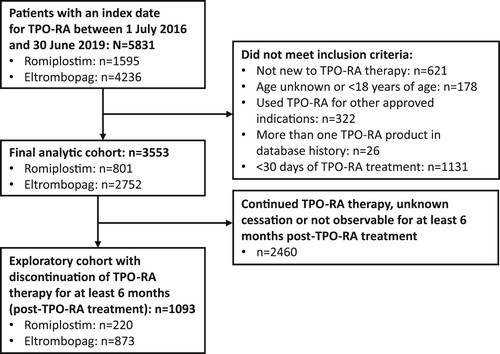
Table 1. Demographic parameters of included participants.
Figure 2. Cumulative incidence of (A) all patients treated with corticosteroids at any point during the 18 months prior to the index date and (B) all patients treated with immunoglobulin at any point during the 18 months prior to the index date. Gray lines represent 95% confidence intervals.
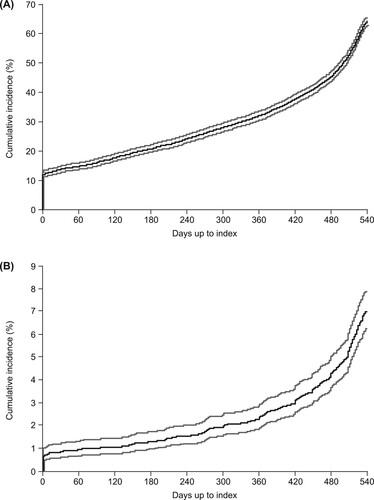
Table 2. Corticosteroid use before, during and after TPO-RA treatment.
Figure 3. Proportion of patients receiving (A) corticosteroids on each day prior to the index date and (B) immunoglobulins on each day prior to the index date. Gray lines represent 95% confidence intervals.
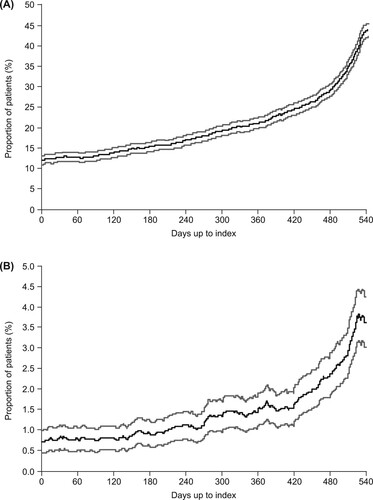
Figure 4. Persistence on thrombopoietin receptor agonists (TPO-RAs).
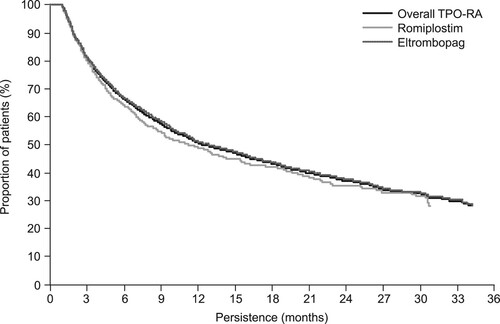
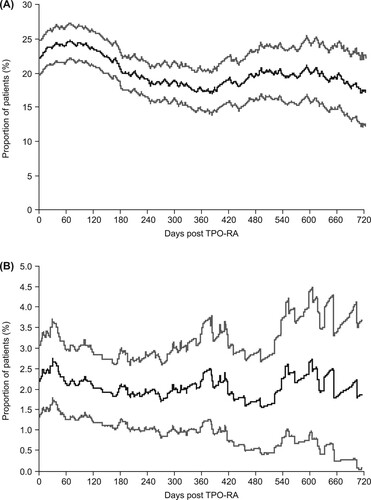
Figure 5. Proportion of patients receiving (A) corticosteroids on each day after the index date during the thrombopoietin receptor agonist (TPO-RA) treatment period and (B) immunoglobulins on each day after the index date during the TPO-RA treatment period. Gray lines represent 95% confidence intervals.
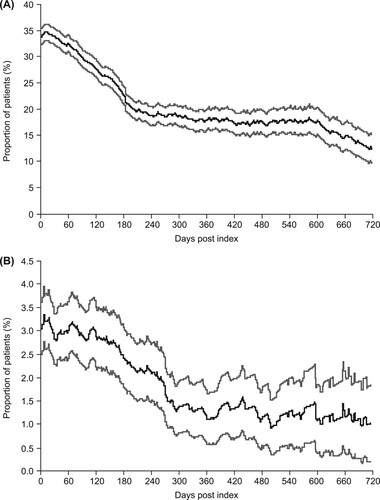
Figure 6. Proportion of patients receiving (A) corticosteroids on each day after thrombopoietin receptor agonist (TPO-RA) treatment ceased and (B) immunoglobulins on each day after TPO-RA treatment ceased. Gray lines represent 95% confidence intervals.
Data availability statement
The data that have been used in this study are confidential.