
Figures & data
Figure 1. Flowchart detailing causes of exclusion, number of patients included and number of relapses.
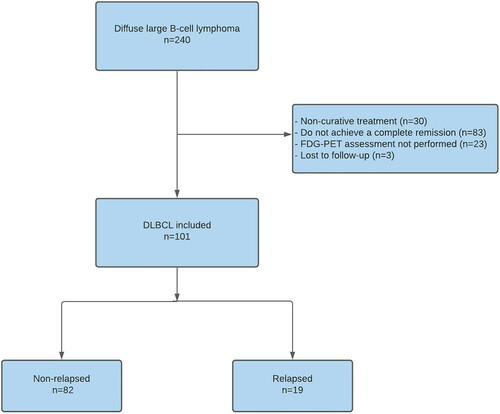
Figure 2. Overall survival (A) and progression-free survival (B) in diffuse large B-cell lymphoma.
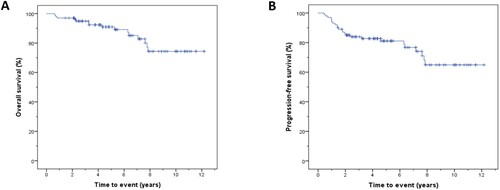
Table 1. Patient characteristics at diagnosis and treatment.
Table 2. Patient characteristics at relapse.
Table 3. Type of suspicion of relapse within the first year and from the second year.
Table 4. CT scans exposure up to five years of follow-up.