Figures & data
Figure 1. (a) Signs and symptoms of ITP experienced by respondents (n = 31). (b) Signs and symptoms of ITP ranked most negatively impactful on quality of life by respondents (n = 30, one respondent reported experiencing no symptoms).
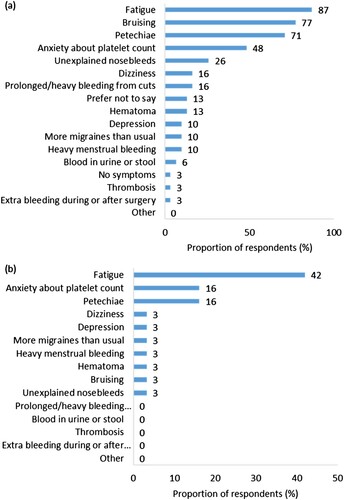
Figure 2. (a) Respondents’ perception of change in ITP condition since diagnosis (n = 31). Percentages may not add up to 100 due to rounding. (b) Respondents’ perception of stability of ITP condition in the 3 months prior to survey completion (n = 31).
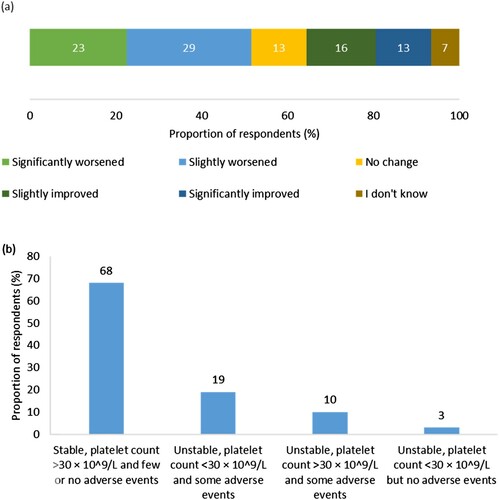
Figure 3. (a) Proportion of respondents (%) currently or most recently receiving romiplostim or eltrombopag (n = 31). (b) Duration (years) that respondents have been treated with their current or most recent TPO-RA (n = 31). The endpoints of the whiskers = minimum and maximum values; the points where the whiskers meet the box = first and third quartiles; the line in the box = median; the cross in the box = mean; the dot = outlier. (c) Proportion of respondents (%) who have previously received romiplostim or eltrombopag (n = 13). (d) Reasons respondents discontinued their previous TPO-RA treatment (n = 13). Percentages may not add up to 100 due to rounding.
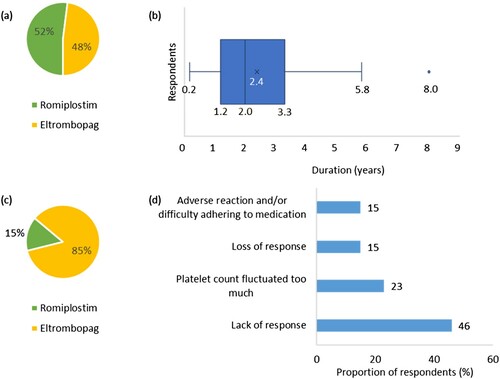
Figure 4. Other therapies that respondents currently take, used to or have never taken for ITP (n = 31). Percentages may not add up to 100 due to rounding.
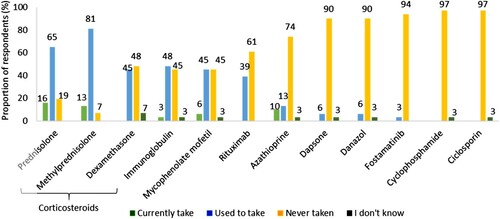
Figure 5. Respondents’ degree of agreement to statements regarding their current or most recent TPO-RA treatment (n = 31). Percentages may not add up to 100 due to rounding.
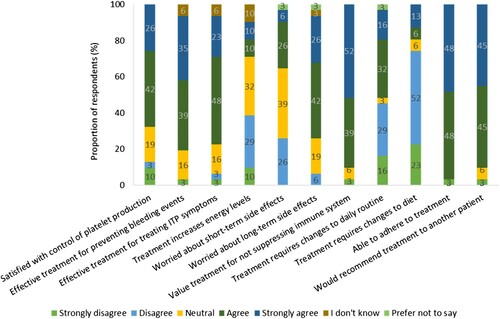
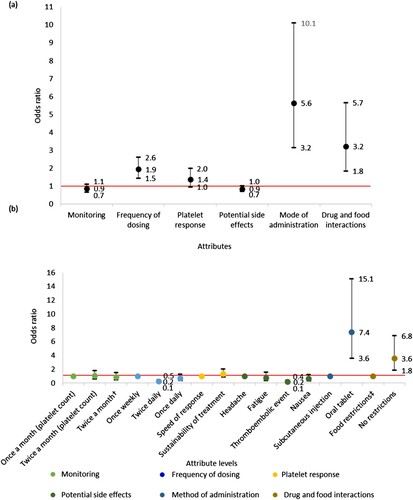
Figure 6. (a) Association between TPO-RA attributes and participant preference towards TPO-RA treatments (n = 31). The red line indicates no effect (odds ratio = 1). The black lines indicate the lower to upper confidence intervals. (b) Association between TPO-RA attribute levels and participant preference towards TPO-RA treatments (n = 31). The red line indicates no effect (odds ratio = 1). For each attribute category, the first attribute level plotted is the reference level. Upper CI, upper confidence interval; the black lines indicate the lower to upper confidence intervals. †Two separate tests: one for measuring platelet count and one for liver function. ‡Treatment must be taken 2 h before or 4 h after food containing dairy products or calcium; indigestion remedies (antacids); or mineral supplements.