
Figures & data
Table 1. Patient characteristics by CRS Grade.
Figure 1. The incidence and first time begin fever of CRS after haplo-HCT. (A) Incidence of CRS. (B) Time begin with fever.
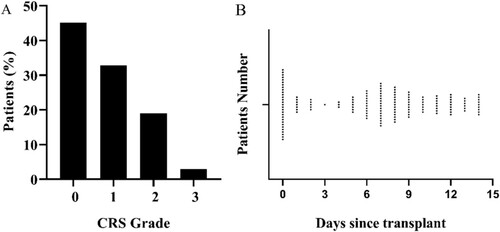
Figure 2. The incidence and severity of CRS after haplo-HCT with different doses of ATG. (A) The number of patients who developed CRS or not with different total doses of ATG (6, 7.5, and 9 mg/kg). (B) The percentage of variant CRS grade of patients who applied to different doses of ATG.
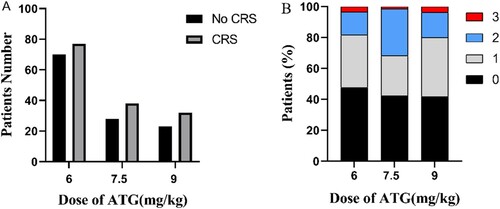
Table 2. Frequency of infection in the first one year after haplo-HCT, stratified by CRS severity
Table 3. Univariate analysis between patients with CRS and no CRS
Figure 3. Kaplan-Meier curves by CRS of association with (A) OS and (B) DFS, and cumulative incidence of (C) relapse and (D) NRM according to CRS. (A) OS. (B) DFS. (C) Relapse. (D) NRM.
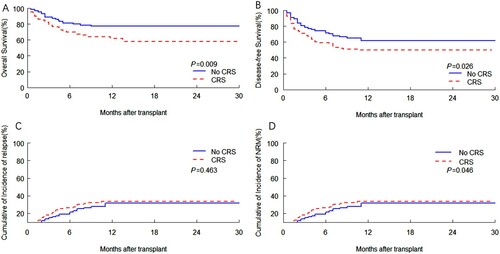
Figure 4. Kaplan-Meier curves by CRS of association with (A) OS and (B) DFS, and cumulative incidence of (C) relapse and (D) NRM according to CRS, among patients limited to NR cohort. (A) OS. (B) DFS. (C) Relapse. (D) NRM.
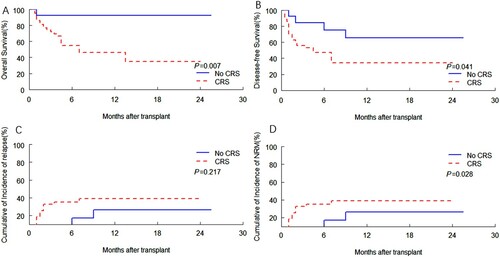
Table 4. The cause of death between patients with CRS and no CRS