
Figures & data
Figure 1. Detection of Metrix metalloproteinase (MMP) in pediatric acute lymphoblastic leukemia case. (A): Forwards/side gating on blat population. (B): Fluorescein isothiocyanate (FITC) Isotype control, (C): phycoerythrin (PE) isotype control, (D): MMP-9, (E): Tissue inhibitor of metalloproteinases 1 (TIMP-1) and (F): MMP-2. (G): represent the stem cells gating on the blast population. (H): select the CD34+CD38− population gated on the whole blast population R1.
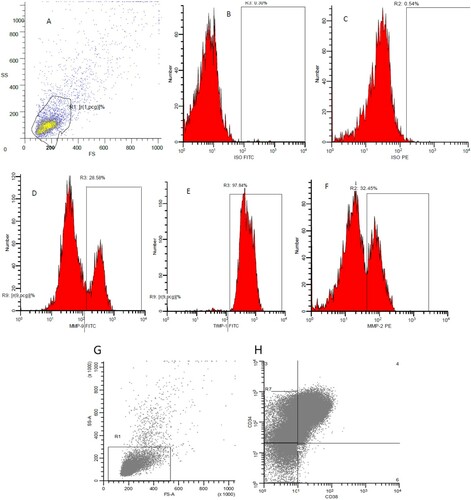
Table 1. Clinical characteristics of ALL patients.
Figure 2. Expression levels of (A) TIMP-1, (B) MMP-2, (C) MMP-9 and (D) CSCs CD38+CD34− in ALL patients compared to control subjects.
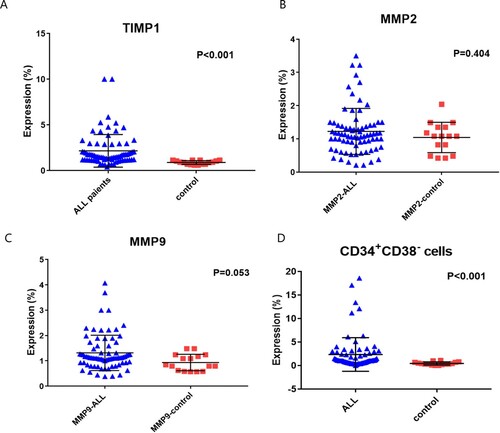
Figure 3. ROC analysis for diagnosis of ALL patients using (A) TIMP-1, MMP-2, MMP-9 and (B) CSCs CD34+CD38−. (C) association between MMP-9/TIMP-1 ratio and complete remission of pediatric ALL patients. (D) Correlation among MMP-2, MMP-9, TIMP-1 and CD34+CD38− cells expressions in the control group. (E) Correlation among MMP-2, MMP-9, TIMP-1 and CD34+CD38− cells expressions in pediatric ALL patients.
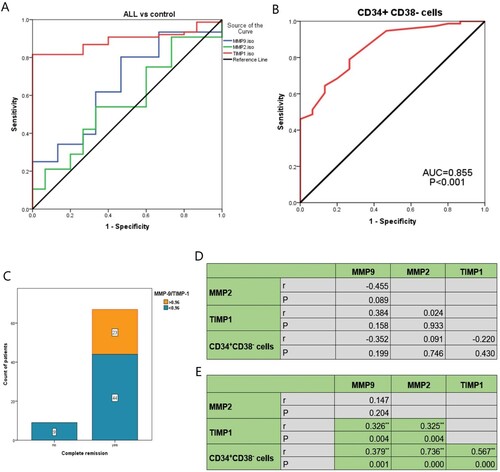
Table 2. ROC curve analysis of TIMP1, MMP2, MMP9 and CD34+CD38− stem cells for identification of ALL patients.
Table 3. Association between MMP9, MMP2 and clinical features of the patients.
Table 4. Association between TIMP1, CD34+ CD38− and clinical features of the patients.
Figure 4. Risk stratification of the patients according to TIMP-1 expression.
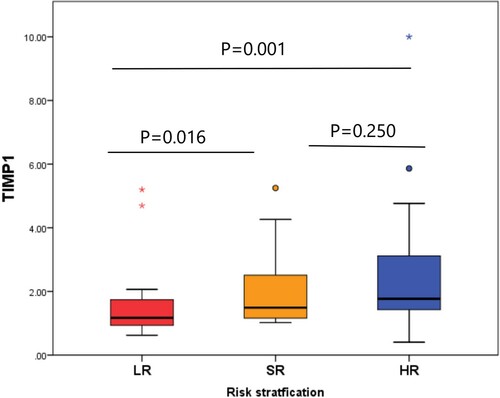
Figure 5. Analysis of disease-free survival and overall survival rates of the ALL patients.
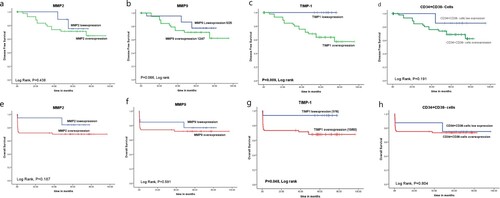
Table 5. Multivariate logistic regression analysis for the incidence of ALL.