Figures & data
Figure 1. Establish K562-A24 cells stably expressing HLA-A*2402. (A) The mRNA expression levels of HLA-A*2402 and WT1 in K562 cells and MM.1S cells. (The data were generated by a TRON Cell Line portal, http://celllines.tron-mainz.de). (B) K562 and K562-A24 cells were stained with phycoerythrin-conjugated antibodies specific to HLA-A24. The percentages of positive cells are presented after exclusion of dead cells with Aqua.
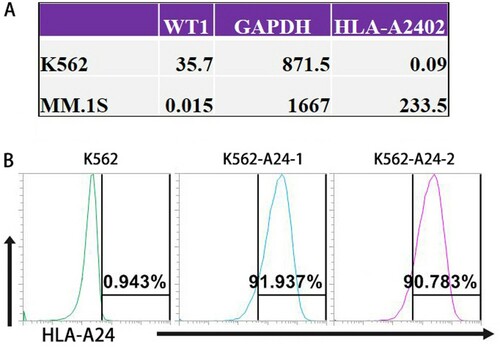
Figure 2. Design and characterization of a WT1/HLA-A*2402-specific CAR. (A) Schematics of a lentiviral vector encoding WT1/HLA-A*2402-specific CAR. (B) Expression of CAR on human T cells. Human T cells stimulated with anti-CD3/CD28/CD2 were transduced with the lentiviral vector as depicted in panel A. Four days after the transduction, cells were stained with phycoerythrin-labeled HLA-A*2402 tetramers presenting WT1 along with FITC anti-CD3, APC anti-CD4 and PE/Cy7 anti-CD8. Mock-transduced T cells served as background staining. (C)Fold expansion of the Mock-T and WT1 CAR-T cells at different time points (n≥3).
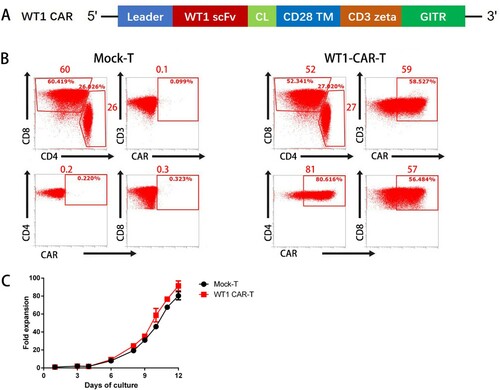
Figure 3. WT1 CAR-T cells react to tumor cell lines endogenously expressing WT1 in an HLA-A*2402–restricted manner. (A) CAR T cells cocultured with K562-A24 cells in triplicate at the indicated E:T ratios. Cytotoxicity was measured using a CytoTox® 96 Non-Radioactive Cytotoxicity assay kit. All data are shown as means ± SD. *P < 0.05, and **P < 0.01. (B) CAR T cells cocultured with K562, K562-A24 or MM.1S cells at an E:T (Effector:Target) ratio of 5:1 for 24 h. Supernatants were collected to detect cytotoxic activity. *P < 0.05, and **P < 0.01.
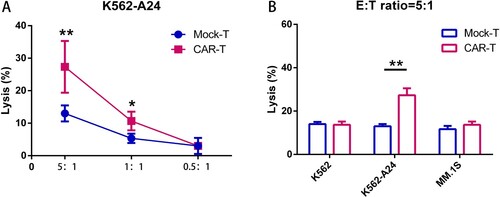
Figure 4. Adoptive transfer of WT1-specific CAR-T cells suppressed tumor growth in an antigen-specific manner. (A) Tumor weights in NCG mice (n=4) transferred with PBS, CAR-T cells or Mock-T cells. NCG mice were inoculated s.c. with K562 and K562-A24 (3×10⁶ cells). Four days following tumor inoculation, mice received two doses of 5 million CAR-T cells, Mock-T cells or PBS. 18 d later mice were sacrificed and the tumors were excised weighted. Error bars represent SD of the mean. *P < 0.05. s.c., subcutaneous.
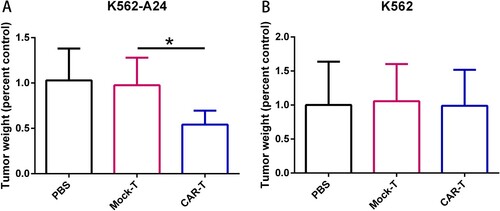
Figure 5. LEN enhances the effectiveness of WT1 CAR-T Cells in a Dose-dependent manner. (A) WT1 CAR T cells treated with different concentrations of lenalidomide were co-cultured with K562 and K562-A24 at a E:T ratio of 5 to 1 for 24 h. Supernatants were collected to detect cytotoxic activity (A) and cytokine production (B).
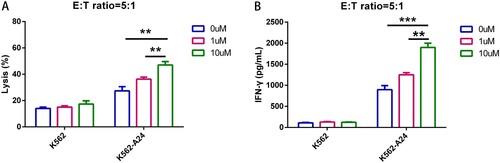
Figure 6. LEN enhances antitumor response in vivo. (A) NCG mice were inoculated s.c. with K562 and K562-A24. Four days following tumor inoculation, mice received two doses of 5 million CAR-T cells specific for WT1 at days 4 and 8 and daily i.p injections of 10 mg/kg lenalidomide.18 d later mice were sacrificed and the tumors were excised weighted. (C, D) The infiltration of tumors by T cells was analyzed by flow cytometry in a cell suspension prepared from excised tumors using antibodies to CD3+ (C) and CD8+(D), one representative mouse is shown. Average from four replicates are depicted. C + L: CAR-T+ Lenalidomide.
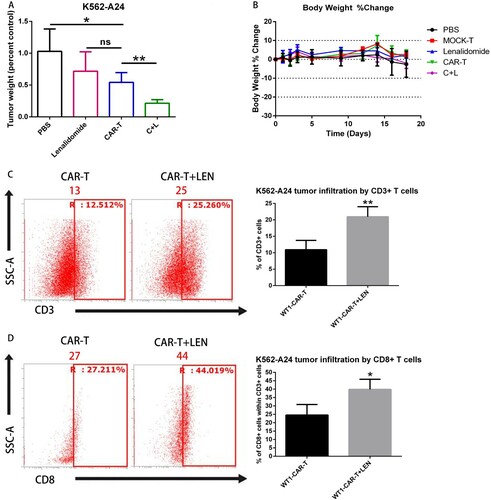
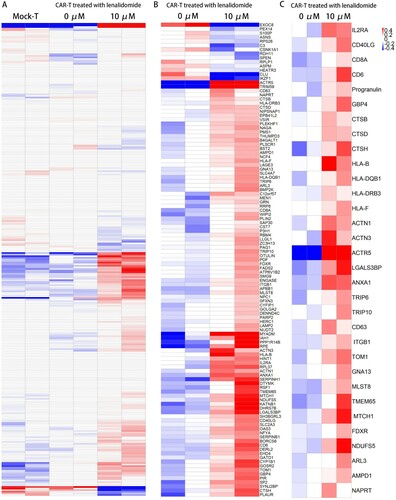
Figure 7. Proteomic profiles of WT1 CAR-T cells with and without LEN. (A) Heat map of proteins with differential expression (P < 0.05) between Mock-T cells and CAR-T cells treated with and without lenalidomide. As compared to the Mock-T cells, WT1 CAR-T were found to have highly similar changes in protein expression pattern. (B) Heat map of proteins with differential expression (P value < 0.05) between WT1 CAR-T cells treated with and without lenalidomide. (C) Heat map of selected proteins with differential expression (P < 0.05) between CAR-T cells related to T cell activation, expression of the MHC class I and II molecules, synapse and the mitochondrial activity (n = 2 replicates per group).