
Figures & data
Table 1. Demographic and characteristics of patients.
Table 2. Level of intracellular ROS and iron in CD34+ cells of bone marrow.
Table 3. Iron stain of bone marrow in MDS patients.
Figure 1. Influence of IOL on median survival time and LFS of MDS patients. A: A median survival time for MDS patients with IOL and NIOL (P = 0.040); B: The survival rate of LFS of MDS patients with IOL and NIOL (P = 0.037).
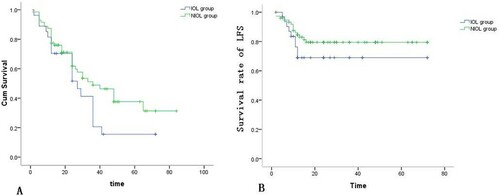
Table 4. Abnormality of chromosome of MDS.