Figures & data
Figure 1. miR-149-3p attenuates proliferation of U-937 and HL-60 cells. (A) qRT-PCR was performed to detect the expression of miR-149-3p in U-937 cells after transfection. (B) qRT-PCR was performed to detect the expression of miR-149-3p in HL-60 cells after transfection. (C) CCK-8 assay was performed to detect the viability of U-937 cells after transfection. (D) CCK-8 assay was performed to detect the viability of HL-60 cells after transfection. Data represents the mean ± standard deviation. # p < 0.05.
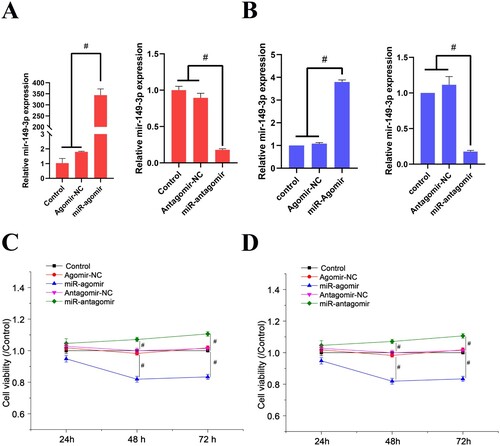
Figure 2. miR-149-3p promotes apoptosis of U-937 and HL-60 cells. (A) Hoechst 33258 staining was performed to examine the apoptosis of U-937 cells after transfection. (B) Flow cytometry was performed to detect apoptosis of U-937 cells after transfection. (C) Flow cytometry was performed to detect apoptosis of HL-60 cells after transfection. Data represents the mean ± standard deviation. * p < 0.05 vs. control; @ p < 0.05 vs. Agomir-NC; ^ p < 0.05 vs. Antagomir-NC.
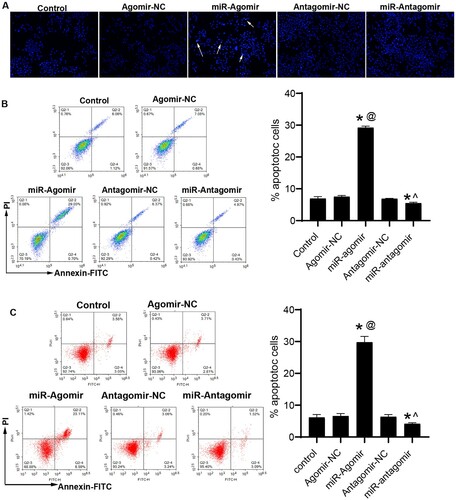
Figure 3. miR-149-3p regulates expression of proteins associated with apoptosis and EMT in U-937 cells. (A) qRT-PCR was performed to evaluate the mRNA expression of apoptosis-related indicators. Western blot was performed to evaluate the expression of proteins associated with (B) apoptosis and (C) EMT. Data represents the mean ± standard deviation. * p < 0.05 vs. control; @ p < 0.05 vs. Agomir-NC; ^ p < 0.05 vs. Antagomir-NC.
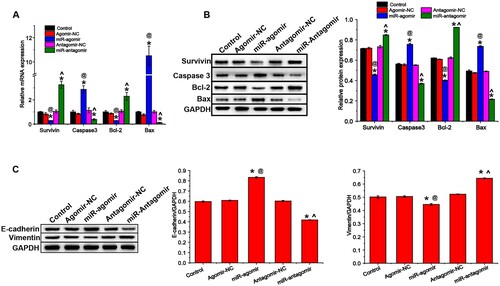
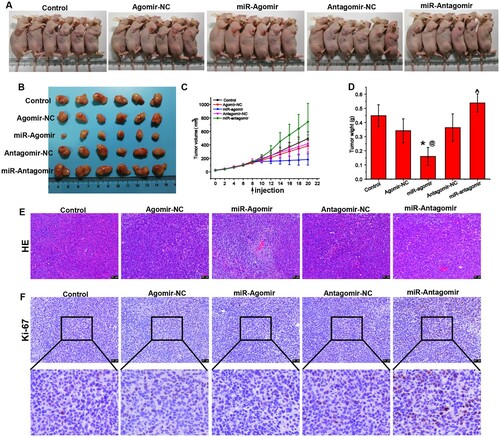
Figure 4. miR-149-3p suppresses U-937-induced tumor growth. (A) Representative photos of tumor-bearing mice injected with U-937 cells and treated with miR-antagomirs/antagomirs. (B) Representative photos of tumors extracted from the mice. (C) Growth curve of tumor xenografts in mice. (D) Tumor weight on day 11 after treatment with miR-antagomirs/antagomirs. (E) HE staining of tumor tissue. (F) Immunohistochemical staining of Ki-67 protein expression in tumor tissue. Data represents the mean ± standard deviation. * p < 0.05 vs. control; @ p < 0.05 vs. Agomir-NC; ^ p < 0.05 vs. Antagomir-NC.