
Figures & data
Table 1. Baseline characteristics of AML patients in The Cancer Genome Atlas AML cohort (TCGA-LAML) and the Ewha study group.
Figure 1. Relative gene expression of DNA repair genes between APL and non-APL AML, (A) percentage of GAPDH as a comparator using RNA-expression profiling on the Affymetrix U133 Plus 2 platform in The Cancer Genome Atlas AML cohort (TCGA-LAML), and (B) fold changes compared to normal controls using quantitative PCR with an RT2 Profiler PCR array system in the Ewha study group. The horizontal bars represent medians, boxes represent inter-quartile ranges, and dotted lines represent 5th and 95th percentiles. Abbreviations: APL, acute promyelocytic leukemia.
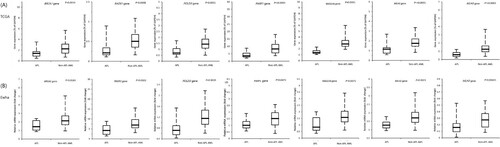
Figure 2. Relative gene expression of RAD23A, RAD23B, FEN1, and XRCC1 DNA repair gene in non-APL AML risk subgroups (A) using the TCGA-LAML cohort and (B) the Ewha study group. Post-hoc comparison was performed among risk groups. The horizontal bars represent medians, boxes represent inter-quartile ranges, and dotted lines represent 5th and 95th percentiles.
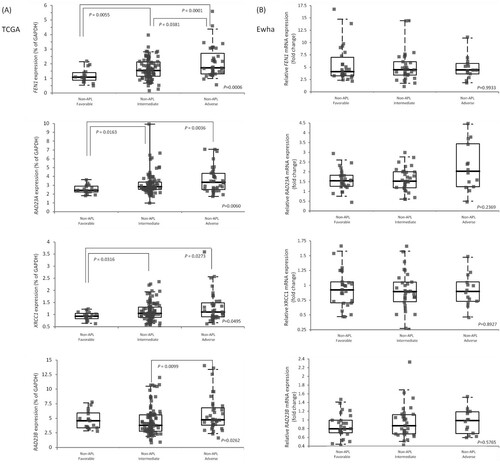
Figure 3. Overall survival of non-APL AML patients (A) according to PARP1, XRCC1, RAD51, and RAD23A in the TCGA cohort and (B) PARP1, XRCC1, RAD51, BRCA1 and MRE11A expression in the Ewha study group by Kaplan Meier log rank test.
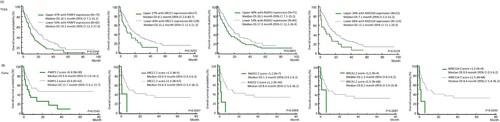
Table 2. Multivariate analysis on overall survival of DNA repair genes in non-APL AML patients in the Ewha study group.
Figure 4. Kaplan Meier survival curves of (A) according to the risk groups among all AML patients, and (B) based on the expression levels of DNA repair genes among non-APL AML patients in the Ewha study group. * Patients with at least one gene or more showing Z-scores greater than 1.5. † The remaining patients. Abbreviations: APL, acute promyelocytic leukemia.
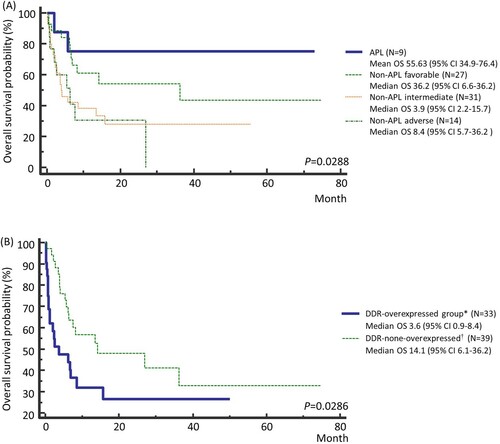
Table 3. Outcomes of non-APL AML according to the AML risk group and DNA damage response Expression group in the Ewha study group.
Supplemental Material
Download MS Word (3.4 MB)Supplemental Material
Download MS Word (32.1 KB)Data availability statement
The TCGA-LAML datasets analyzed for this study can be found in the GDC data portal (https://portal.gdc.cancer.gov). The datasets generated and analyzed of Ewha study group are not publicly available.