
Figures & data
Table 1. Characteristics of samples used in this study.
Figure 1. Changes of glycosylation modification in MM patients, and identification of the differentially expressed proteins with quantitative proteomics. (a) 12% SDS-PAGE was used to detect the protein expression in plasma of controls and MM patients. (b) The changes of glycosylation levels in peripheral blood and bone marrow were detected by lectin-blot. The membrane was incubated with AANL6 (0.5 μg/mL) at RT for 1 h, and washed with 0.3% TBST for six times, then the membrane was probed with rabbit polyclonal antibodies against AANL6 (1:10000) at RT for 1 h. (c) Workflow of identification by LC-MS/MS. The proteins from 6 mixed plasma samples of control subjects and 6 mixed plasma samples of MM patients were treated via precipitation, resuspension, reduction in 10 mM DTT and alkylated by 40 mM iodoacetamide, and finally digested and digested with 2 μg/μL trypsin (Mass spectrometry grade, Promega) for overnight, respectively. 2 mg of the desalted peptides from the control subjects and the MM patients were labelled with dimethyl reagents, and mixed. The labelled peptides were incubated with AANL6 for 3.5 h, the lectin-bound glycosylated peptides were digested with PNGase F for 2.5 h at 37°C. Finally, the deglycosylated peptides were collected and desalted, then dried for LC-MS/MS with a quadrupole TOF LC-MS/MS mass spectrometer (Triple TOF 5600, AB Sciex Instruments). (d) The differentially expressed proteins were analysed by GO annotation using BGI WEGO website (http://wego.genomics.org.cn). CC, cellular component; MF, molecular function; BP, biological process. (e) Protein–protein interaction network was analysed using STRING v9.1 (https://string-db.org/cgi/input.pl).
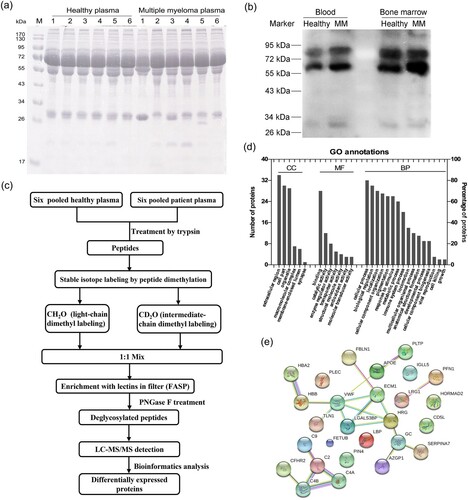
Table 2. Identification of 7 peptides with 99% confidence in FBLN1 by LC-MS/MS.
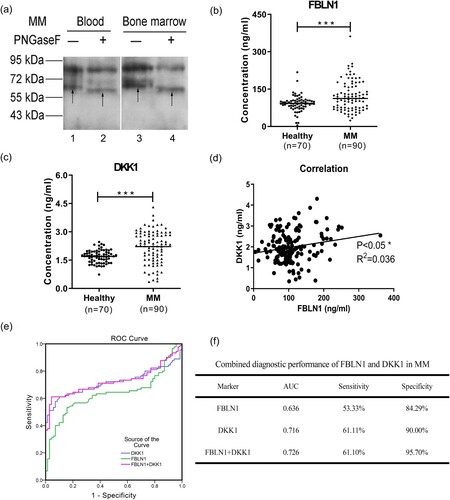
Figure 2. The expression levels, correlation analysis, and ROC analysis of FBLN1 and DKK1 in plasma of MM patients. (a) N-linked glycosylation of FBLN1 was detected by western blot after PNGase F treatment. The samples were treated with denaturation buffer and boiled at 100°C for 10 min for denaturation, and then returned to RT. The denatured proteins were reacted directly with 500 U PNGase F (New England BioLabs) in the reaction buffer at 37°C for 2 h. Subsequently, the deglycosylated proteins were analysed by western blot and the membranes were incubated with anti-FBLN1 (1:150, No: MAC472Hu22) antibodies. Lane 1, 3 represents the band of FBLN1 as arrows shown. Lane 2, 4 represents the deglycosylated band of FBLN1 as arrows shown. (b) Detection of the expression of FBLN1, and the data statistics were analysed using GraphPad Prism (version6.0). (c) Detection of the expression of DKK1. (d) The correlation analysis of FBLN1 and DKK1 in plasma of MM patients using Graphpad Prism. (e) ROC curve and AUC analysis was constructed with IBM SPSS statistics (version 19.0) software. The new probability is calculated by binary logic regression for combination diagnosis analysis. (f) Combination of FBLN1 and DKK1 for diagnosis of MM. p < 0.05 is considered as significant differences in all statistical comparisons.
Supplemental Material
Download MS Word (17 KB)Supplemental Material
Download MS Excel (40.9 KB)Data availability
All datasets generated for this study are included in the manuscript and/or the supplementary files. The mass spectrometry proteomics data have been deposited to the ProteomeXchange Consortium via the PRIDE partner repository with the dataset identifier PXD027111 (Username: [email protected]; Password: J9lmPWLJ).