Figures & data
Figure 1. Flow diagram of ITP patients enrollment and the study design.
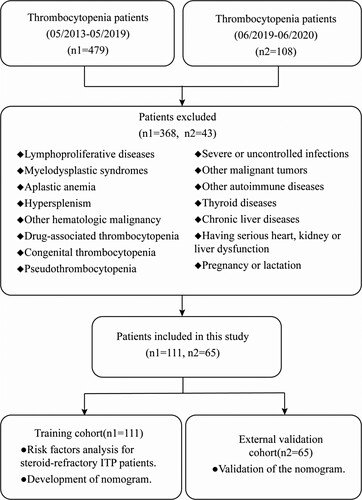
Table 1. Characteristics of ITP patients in training and external validation cohort.
Table 2. Risk factors of steroid-refractory ITP patients in the training and external validation cohort.
Table 3. Multivariate logistic regression analysis for steroid-resistance in ITP patients.
Figure 2. Nomogram for predicting the risk of steroid-resistance in ITP patients.
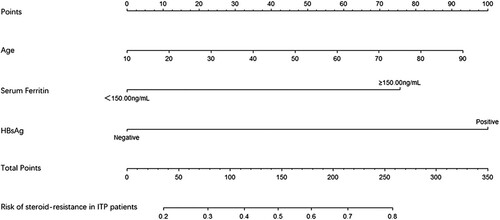
Figure 3. Calibration plots of the nomogram for predicting steroid-resistance in ITP patients. (A) Calibration plots of the nomogram for the training cohort. (B) Calibration plots of the nomogram for the external validation cohort. The diagonal dotted line represents a perfect prediction by an ideal model. The solid line stands for the performance of the nomogram, of which a closer fit to the diagonal dotted line represents a better prediction of the nomogram.
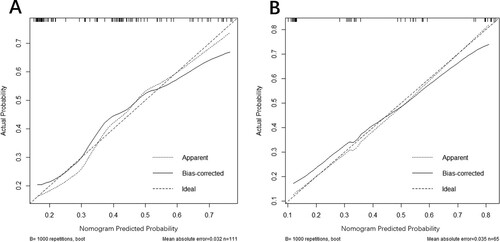
Figure 4. ROC curve analysis to predict steroid-resistance in ITP patients. (A) ROC curve for the training cohort. (B) ROC curve for the external validation cohort.
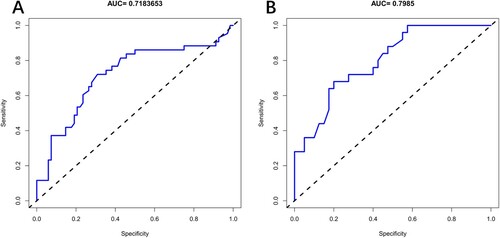
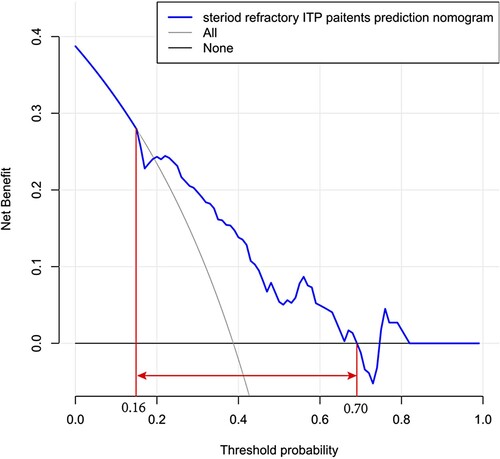
Figure 5. Decision curve analysis for steroid-refractory ITP patients. The y-axis represents the net benefit, and the x-axis represents the steroid-refractory threshold probability in ITP patients. The blue line represents the prediction nomogram of steroid-refractory ITP patients. The gray line represents the assumption that all patients were steroid-resistant. The black line represents the assumption that no patients were steroid-resistant. The decision curve showed that predicting the steroid-refractory risk in ITP patients using this nomogram with a range of the threshold probability between >16% and <70%.